Figure 2.
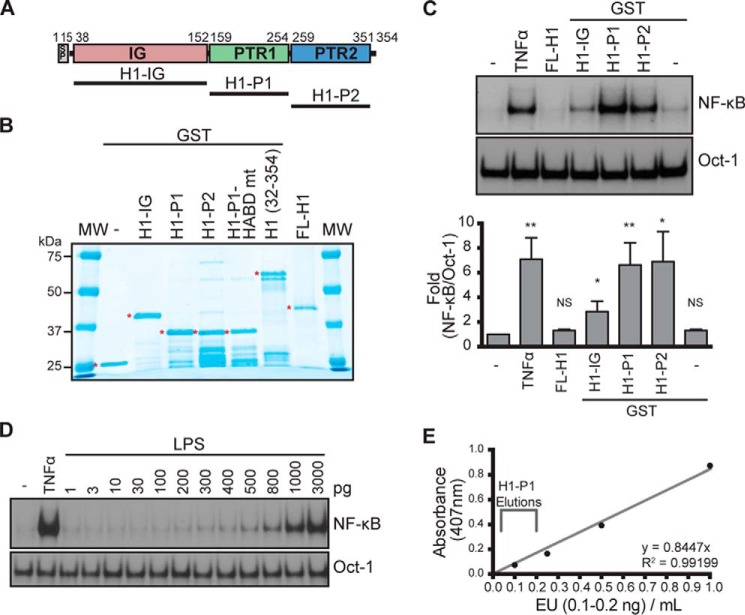
Generation and characterization of recombinant HAPLN1 proteins. A, diagram of HAPLN1 domains. The numbers indicate the amino acid positions. SP, signal peptide; IG, immunoglobulin-like domain; PTR1, proteoglycan tandem repeat 1 domain; PTR2, proteoglycan tandem repeat 2 domain. B, SDS-PAGE and GelCodeTM staining of GST-fused HAPLN1 domain proteins. Full-length (FL) HAPLN1 (not GST-tagged) is from R&D. *, band of interest. C (top), representative EMSA analysis of NF-κB and Oct-1 activities in RPMI8226 cells following incubation with FL-H1, GST-fused H1-IG, H1-P1, and H1-P2 at 100 nm for 4 h or TNFα (10 ng/ml) for 15 min. Bottom, graph represents results of the mean -fold NF-κB activation ± S.D. (error bars) of three independent EMSA experiments shown above. *, p < 0.05; **, p < 0.01 when compared with appropriate control (untreated or GST only). D, representative EMSA analysis of three independent experiments where RPMI8226 cells were stimulated with increasing doses of lipopolysaccharide (LPS) for 1 h or 10 ng/ml TNFα for 15 min. E, representative graph of three independent endotoxin quantifications using the Pierce LAL chromogenic endotoxin quantification kit (Thermo Fisher Scientific). Depicted is the span of the average amount of endotoxin found in three independent H1-P1 purifications. The eluted fractions were further diluted 50–100-fold when added to culture media for NF-κB activation analyses, making the levels of contaminating lipopolysaccharide at least 3 orders of magnitude below what is detectable for NF-κB activation by EMSA.

