Figure 3.
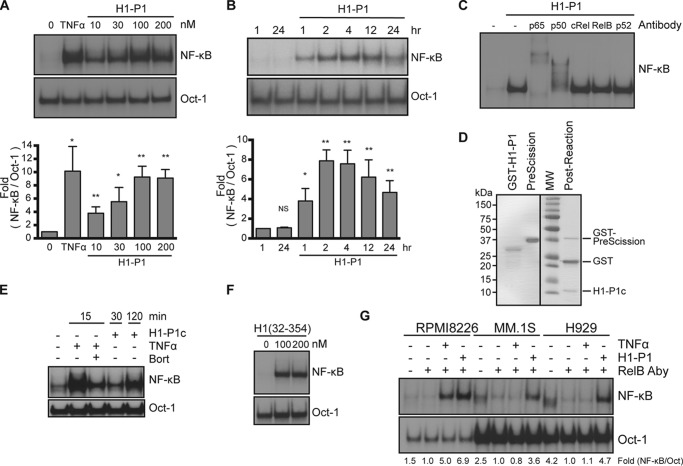
HAPLN1-PTR1 domain activates NF-κB in myeloma cells. A (top), representative EMSA analysis of RPMI8226 cells incubated with increasing concentrations of H1-P1 for 2 h. Bottom, graph represents results of the mean -fold NF-κB activation ± S.D. (error bars) of three independent EMSA experiments (above). *, p < 0.05; **, p < 0.01 when compared with untreated (0 nm). B (top), representative EMSA analysis of RPMI8226 cells incubated with 100 nm H1-P1 for the times indicated. Bottom, graph represents results of the mean -fold NF-κB activation ± S.D. of three independent EMSA experiments (above). *, p < 0.05; **, p < 0.01 when compared with unstimulated 1-h lane. C, supershift analysis of RPMI8226 cells treated with 100 nm H1-P1 for 2 h using antibodies against the five NF-κB family members. Results are representative of three independent experiments. D, SDS-PAGE and GelCodeTM staining of GST-fused H1-P1 following incubation with GST-fused PreScission protease. H1-P1c, cleaved H1-P1 fragment. E, EMSA analysis of RPMI8226 cells pretreated for 30 min with 100 nm bortezomib as indicated and stimulated with 100 nm H1-P1c or 10 ng/ml TNFα for the times indicated, representative of two independent experiments. F, RPMI8226 cells treated with the indicated concentrations of H1(32–354) for 4 h and analyzed by EMSA, representative of two independent experiments. G, RPMI8226, MM.1S, and H929 cell lines were incubated with 10 ng/ml TNFα for 15 min or 100 nm H1-P1 for 4 h and assayed for induction of NF-κB activity by EMSA, representative of three independent experiments. Where indicated, EMSA was done in the presence of a RelB antibody (RelB Aby) to shift RelB complexes to enable quantification of canonical NF-κB activation. -Fold change of NF-κB DNA binding as measured by phosphor image quantification, corrected for Oct-1 DNA binding control, and normalized to unstimulated but RelB antibody–treated, is indicated below the gel.

