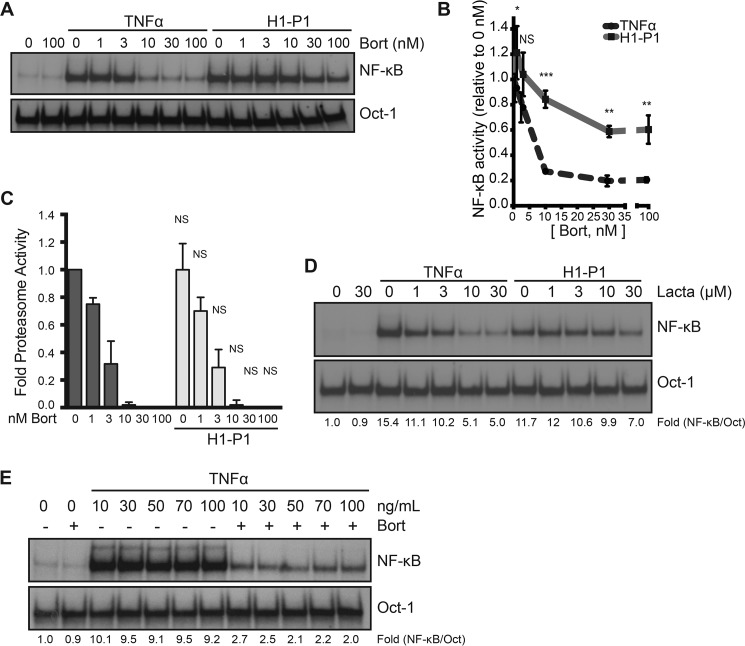
Figure 5.
HAPLN1-PTR1 causes bortezomib-resistant NF-κB activation. A, representative EMSA analysis of RPMI8226 cells incubated with 10 ng/ml TNFα or 100 nm H1-P1 in the absence or presence of increasing concentrations (nm) of bortezomib (Bort). B, graph depicts the mean ± S.D. (error bars) of the quantification of three independent replicates of EMSA analysis as in A. *, p < 0.05; **, p < 0.01; ***, p < 0.001. C, the proteasome activity in RPMI8226 cells was analyzed following treatment with increasing doses of bortezomib (nm) in the presence and absence of 100 nm H1-P1 using a Proteasome-Glo cell-based assay (Promega) and plotted using the basal proteasome activity in 0 nm bortezomib set as 1. Results represent mean ± S.D. of three independent experiments. D, EMSA analysis of RPMI8226 cells incubated with increasing concentrations of lactacystin (μm) and stimulated with 10 ng/ml TNFα for 15 min or 100 nm H1-P1 for 4 h. Results are representative of two independent experiments. E, EMSA analysis of RPMI8226 cells pretreated with 100 nm bortezomib for 30 min and stimulated with increasing doses of TNFα (ng/ml) for 15 min. -Fold change of NF-κB activity was determined as described previously.

