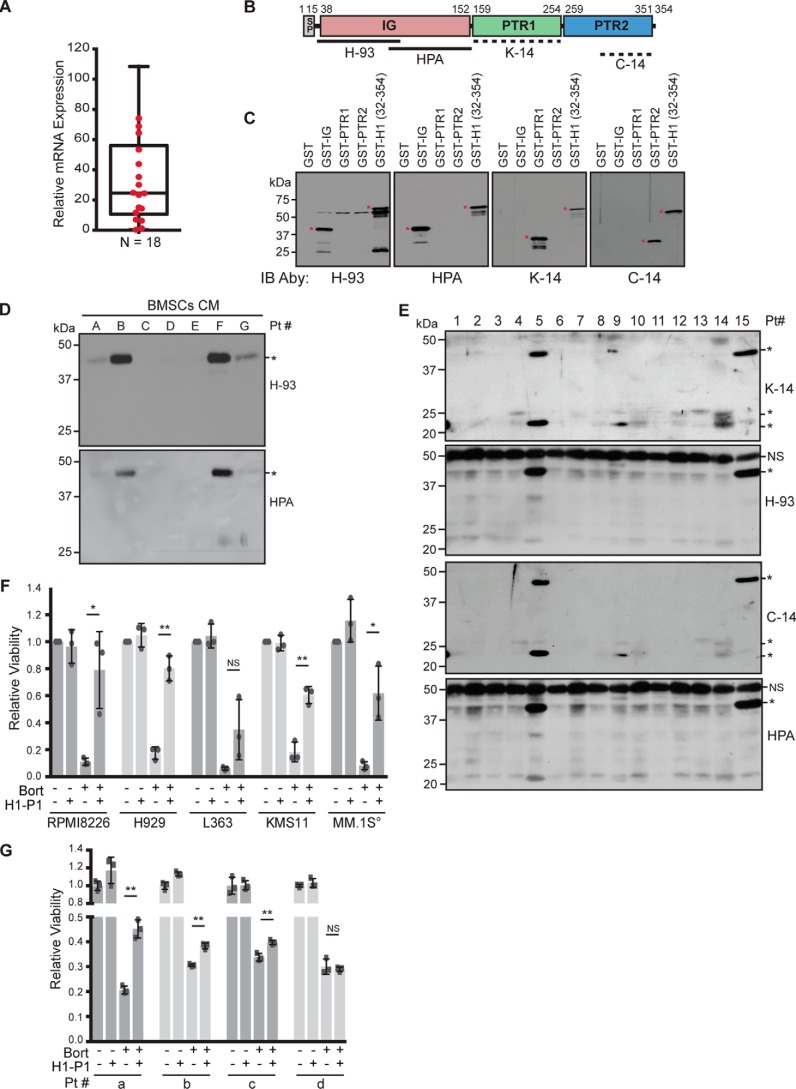
Figure 7.
HAPLN1 is secreted by BMSCs, and HAPLN1-PTR1 causes bortezomib resistance in myeloma cells. A, mRNA expression of HAPLN1 in myeloma BMSCs analyzed by qRT-PCR in triplicate, normalized to GAPDH mRNA expression; the mean for each sample is presented as a box-and-whisker plot. n = 18 myeloma patient BMSCs. B, schematic illustrating the locations of epitopes for different HAPLN1 antibodies utilized. Dashed lines indicate the uncertainty of the specific epitope regions. C, immunoblot analysis of GST-fused HAPLN1 domains showing the epitope specificity of HAPLN1 antibodies utilized. Four parallel SDS-PAGE analyses and immunoblots were performed to independently determine the reactivity of each antibody. *, species of interest. D, immunoblot analysis of HAPLN1 expression from conditioned media collected from myeloma BMSCs for 48 h. *, HAPLN1 immunoreactivities detected by two independent anti-HAPLN1 antibodies, H-93 and HPA019482 (HPA). Results are representative of three biological replicates. Pt, patient. E, immunoblot analysis of HAPLN1 expression in myeloma patient BM plasma fractions with four different HAPLN1 antibodies detecting PTR1 and PTR2 (K-14 and C-14) and IG (H-93 and HPA019482) domains. One membrane was probed with K-14 and H-93, and a second membrane was probed with C-14 and HPA019482. *, HAPLN1 immunoreactivities detected. NS, non-specific. Results are representative of three independent replicates. F, the indicated myeloma cell lines were cultured at 104 cells (°, except for MM.1S at 5 × 10⁴ cells and 3 nm bortezomib (Bort)) with 100 nm GST or 100 nm H1-P1 alone or in combination with 10 nm bortezomib. After 3 days, cell viability was measured by an MTT assay. Each dot represents the mean of biological replicates performed in triplicate. Bar graphs represent the mean of three biological replicates ± S.D. (error bars). *, p < 0.05; **, p < 0.01. G, CD138+ cells from patients were cultured at 1–1.5 × 10⁴ cells with 100 nm GST or 100 nm H1-P1 alone or in combination with 10 nm bortezomib, as indicated. Following 24 h, cell viability was measured by an MTT assay. Each square represents a technical replicate, and the bar graph represents the mean ± S.D. of triplicates. **, p < 0.01.

