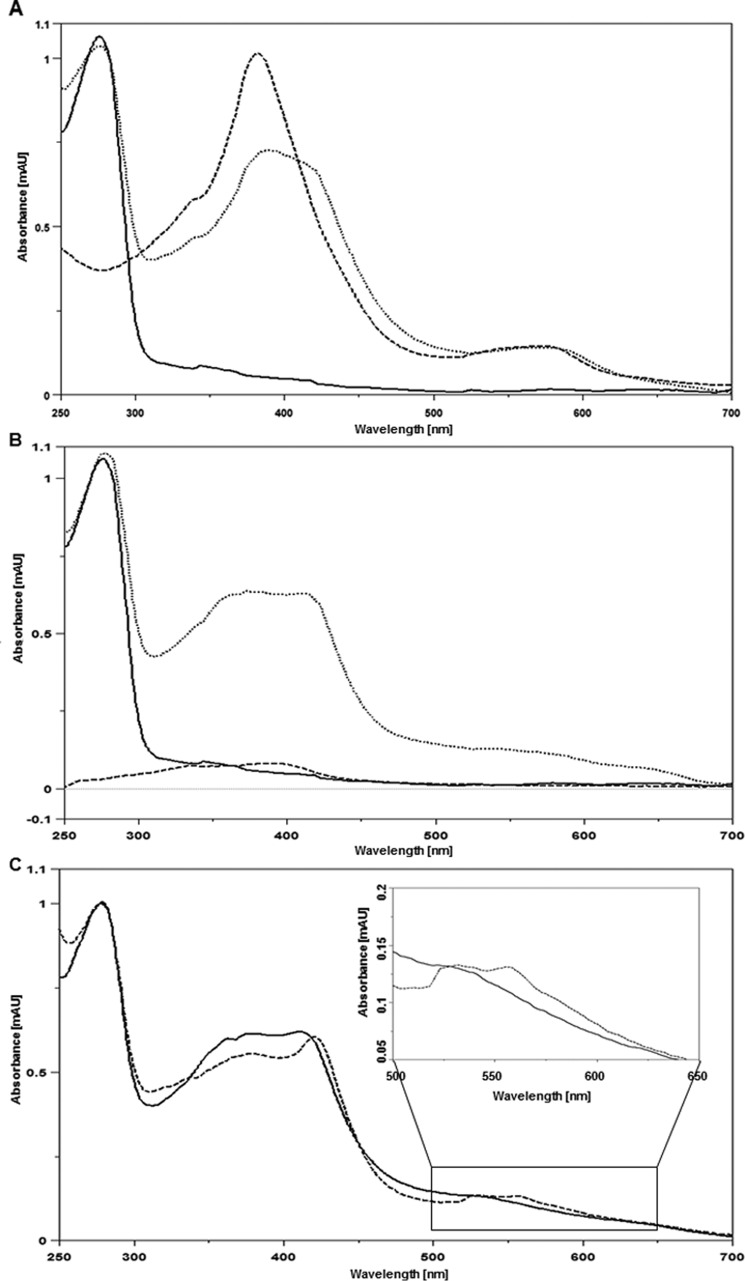
Figure 6.
Spectroscopic characterization of HemW heme binding. Shown are UV-visible spectra from A250 to A700. A, spectra of 20 μm HemW (solid line) and 20 μm HemW after binding of 20 μm heme (dotted line). The dashed line shows the spectrum of 20 μm free heme. B, spectra of 20 μm HemW (solid line), HemW plus bound heme (dotted line), and free heme all after extensive dialysis (dashed line). Free heme was completely removed after dialysis, whereas HemW and the stable HemW-heme complex remained. C, spectra of the 20 μm HemW-heme complex after dialysis (solid line) and after subsequent addition of 1 mm DTT (dotted line). To emphasize the changes at wavelengths from A500 to A650, these parts of the spectra were enlarged. mAU, milliabsorbance units.

