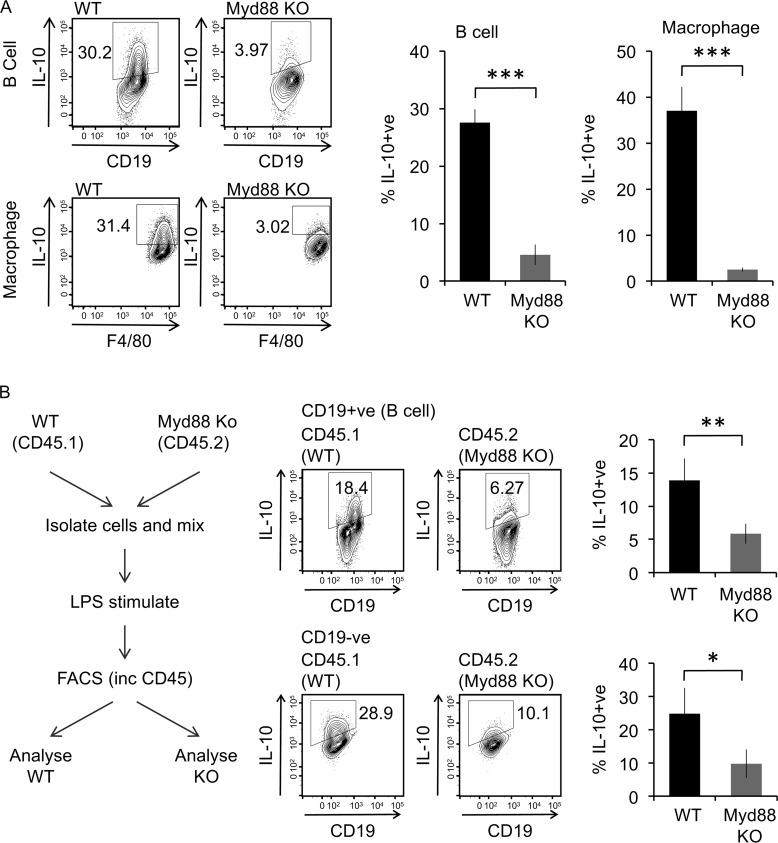
Figure 2.
Effect of Myd88 knockout on IL-10 induction by LPS. A, peritoneal cavity cells from wildtype or Myd88 knockout (KO) mice were either stimulated with 10 μg/ml LPS + brefeldin A + monensin for 5 h. Intracellular IL-10 in B cells and macrophages were assessed by flow cytometry. Representative plots are shown in the left panels. The data shown in the right panels are the average percentages of IL-10+ cells ± standard deviation of biological replicates (n = 3 for wildtype, n = 5 for Myd88 knockout). ***, p < 0.001 (Student's two-tailed unpaired t test). B, peritoneal cavity cells from CD45.1+ve wildtype and CD45.2+ve Myd88 knockout mice were isolated, and equal numbers of cells from each genotype were mixed. The cells were then stimulated ex vivo with 10 μg/ml LPS + brefeldin A + monensin for 5 h. The cells were stained for CD45.1, CD45.2, CD19, and IL-10 and analyzed by flow cytometry. Representative plots for IL-10 in the B-cell population (CD19+ve) and non–B-cell population (CD19−ve) are shown, and the graphs represent the means ± standard deviation of four biological replicates. *, p < 0.05; **, p < 0.01 (Student's two-tailed unpaired t test).

