Figure 6.
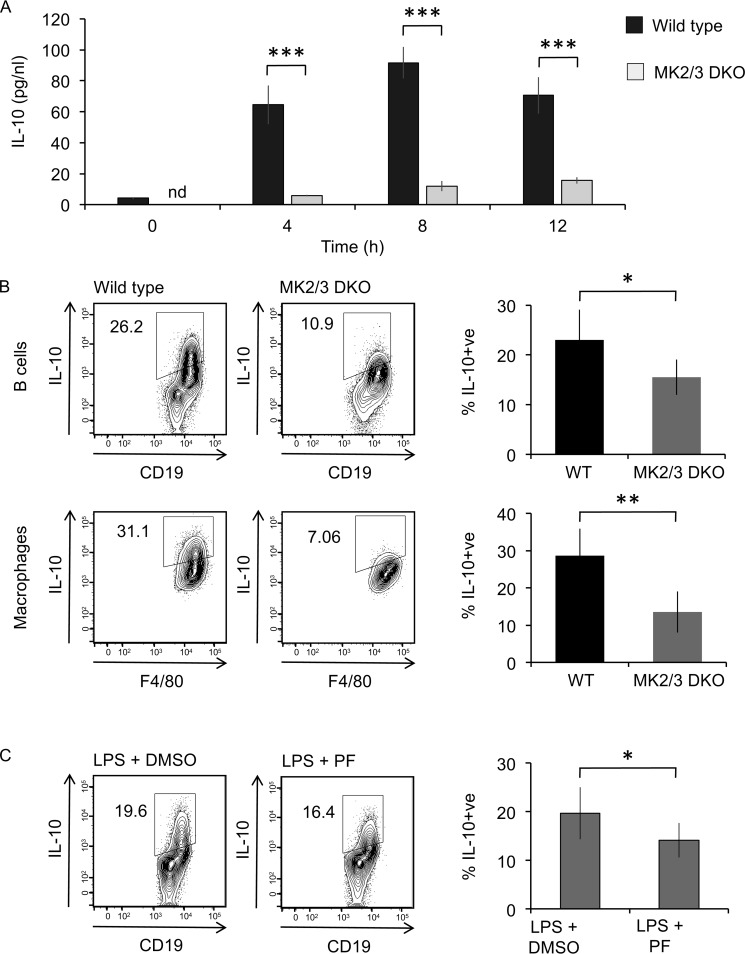
MK2 and 3 contribute to LPS–induced IL-10 production. A, BMDMs were cultured from wildtype and MK2/3 double knockout (DKO) mice. The cells were stimulated with 100 ng/ml LPS for the indicated times, and the levels of IL-10 in the culture supernatant were determined using a Luminex assay. The data show the means ± standard deviation from cultures from four mice/genotype. B, peritoneal cavity cells from wildtype and MK2/3 double knockout mice were stimulated with 10 μg/ml LPS + brefeldin A + monensin for 5 h. Intracellular IL-10 in B cells and macrophages was assessed by flow cytometry. Representative plots are shown in the left panels. The data shown in the right panels represent the averages ± standard deviations of biological replicates (n = 4). C, peritoneal cavity cells from wildtype mice were incubated with 5 μm PF3644022 for 1 h prior to stimulation with 10 μg/ml LPS + brefeldin A + monensin for 5 h. Intracellular IL-10 levels in B cells was assessed by flow cytometry. Representative plots are shown in the left panels. The data shown in the right panel represent the averages ± standard deviations of biological replicates (n = 7). *, p < 0.05; **, p < 0.01; ***, p < 0.001 compared with LPS–stimulated WT cells (two-tailed unpaired Student's t test).

