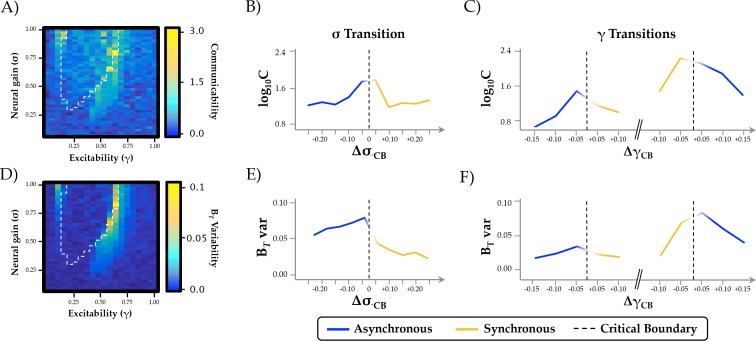
Figure 3. Topological and temporal relationships with phase regimen boundary.
(a-c) network communicability was maximal following the σ boundary (ΔσCP; mean across 0.2 ≤ γ ≤0.6) and the immediately prior to the abrupt phase transition at high γ (ΔγCP; mean across 0.3 ≤ σ ≤1.0); (d-f) time-resolved between-module participation (BT) was maximally variable with increasing σ and across the critical boundary at high γ.

