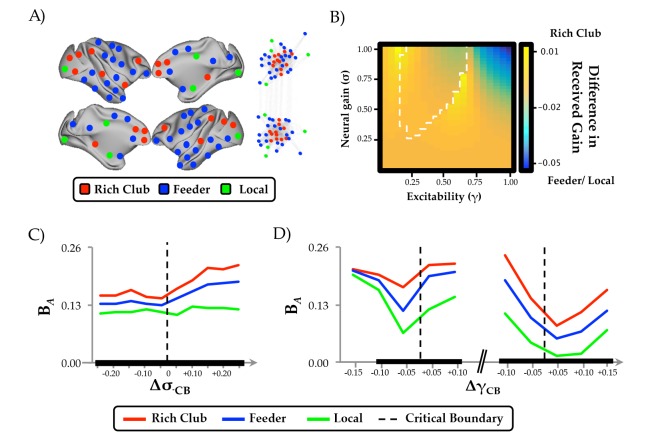
Figure 4. Regional clustering results.
(a) regions from the CoCoMac data organized according to rich club (red), feeder (blue) or local (green) status, along with a force-directed plot of the top 10% of connections (aligned by hemisphere), colored according to structural hub connectivity status; (b) the rich club cluster demonstrated an increase in realized mean gain (the relative output as a function of its’ unique topology) at the bifurcation boundary, compared to feeder and local nodes, which showed higher realized gain at high levels of σ and γ; (c) the three clusters of regions also demonstrated differential responses to neural gain; and (d) excitability. The black lines in (c) and (d) denote significant differences in BA between the two groups.


