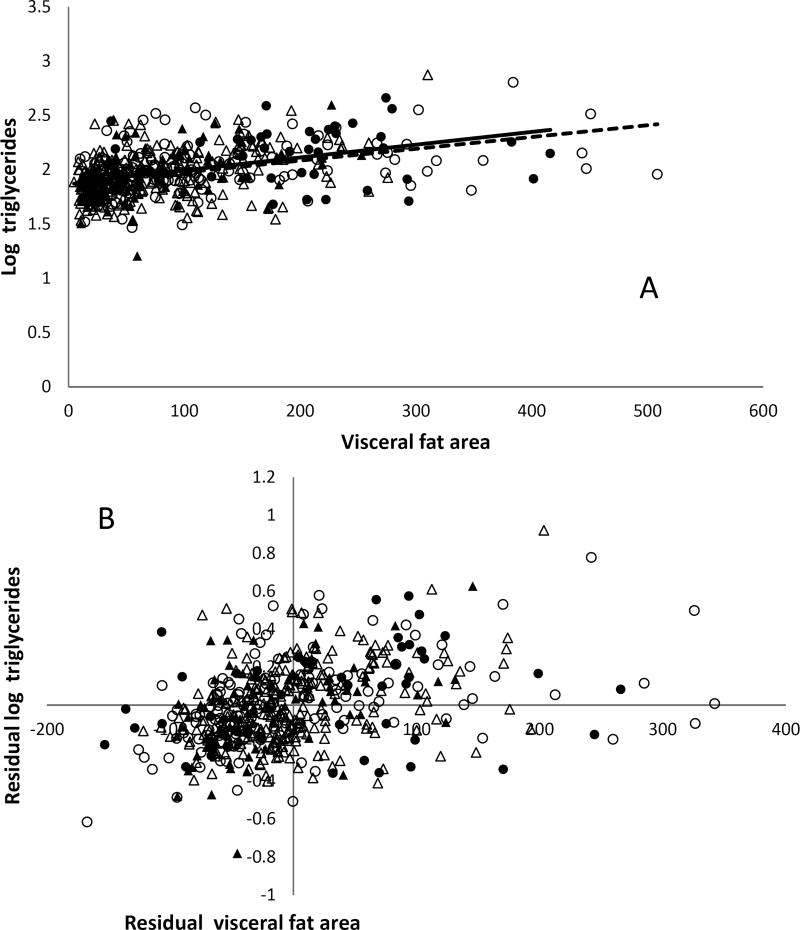
Figure 4. Serum triglyceride concentrations and CT visceral fat area.
A. The relation between log triglycerides and visceral fat area in males (circle) and females (triangle) with (fill) or without (no fill) family history of type 2 diabetes assessed by simple linear regression after grouping by positive (solid line) and negative (dash line) family history of type 2 diabetes. B. The relationship between log triglycerides and visceral fat area in males (circle) and females (triangle) assessed by partial regression leverage plot after adjusting for age, sex, and family history of type 2 diabetes (adjusted R2 = 0.18, P < 0.0001).

