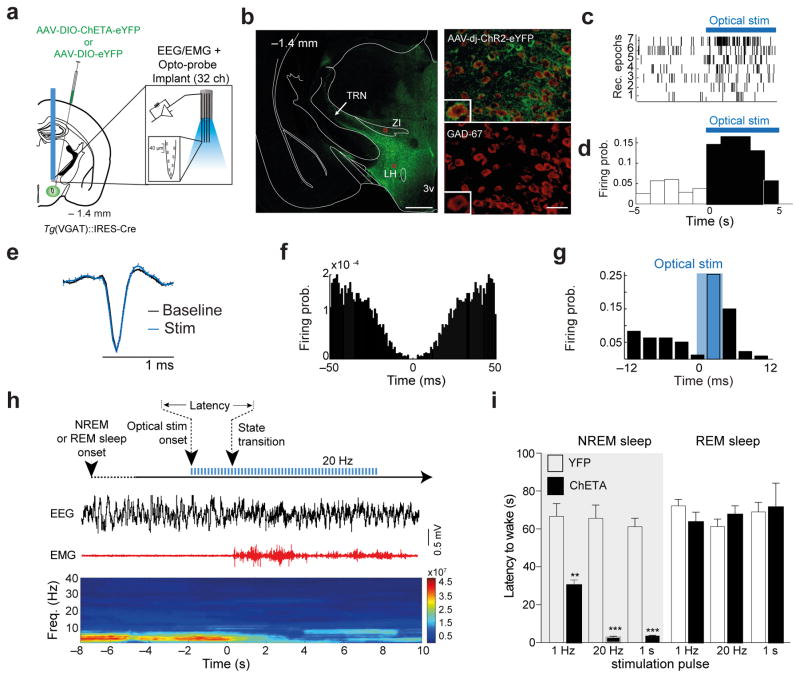
Figure 1. LHGABA neurons control rapid arousal.
a, Schematic of the genetic targeting and optoprobe used or stimulation/recording. AAVdj-DIO-ChETA-YFP or AAVdj-DIO-YFP (Control) were infused into the lateral hypothalamus (LH) of tg(VGAT)::IRES cre mice (left). b, Photomicrograph showing the selective targeting of ChETA-YFP expression in GAD-67+ neurons in the LH (right panels). Scale bar: 500 μm (left), 20 μm (right). Representative images from repeated experiment (>15 sections from N = 4 transduced mice). c, Examples of optostimulation onset-triggered rastergrams of representative 7 LH cells (top; of 31 recorded presumable LHGABA cells) and their firing probability before and after the optostimulation onset (d). e, Average spike waveforms (top) of a representative presumable ChETA-expressing LHGABA cell before (black) and during optostimulation at 20 Hz (blue). f, Auto-correlogram of the unit shown in (e). Traces were obtained from 3 different recordings, N=2 mice. g, Firing probability of a presumable ChETA-expressing LHGABA cell in response to optostimulation. Cross-correlation bin width: 3 ms. h, Schematic of the experimental timeline (top). Representative EEG/EMG traces and the corresponding heat map EEG power spectrum illustrate behavioural response to optogenetic stimulation. Note the decrease of the power (color axis, mV2/Hz) of low frequency (< 4 Hz) oscillations and the EMG tone during the NREM-to-Wake transition. i, Mean latencies ± S.E.M of NREM (left) (1Hz N = 9 ChETA, YFP N = 10, t=4.84 df=17, P= 0.0002; 20Hz N = 9 ChETA, YFP N = 11, t=8.91 df=18, P= 0.00001, 1 s N = 3 ChETA, YFP N = 4, t=11 df=5, P= 0.0001) and REM (right)) (1Hz N = 8 ChETA, YFP N = 10, t=0.213 df=6, P= 0.173; 20Hz N = 8 ChETA, YFP N = 8, t=4.36 df=4.04, P= 0.39, 1 s N = 3 ChETA, YFP N = 5, t=0.0838 df=8, P= 0.8384, Data analysis based on > 15 stimulations per frequency and per animal (N). significance was determined as when P values were **, P <0.001, ***, P < 0.0001 using unpaired two-tailed Student’s t-Test).

