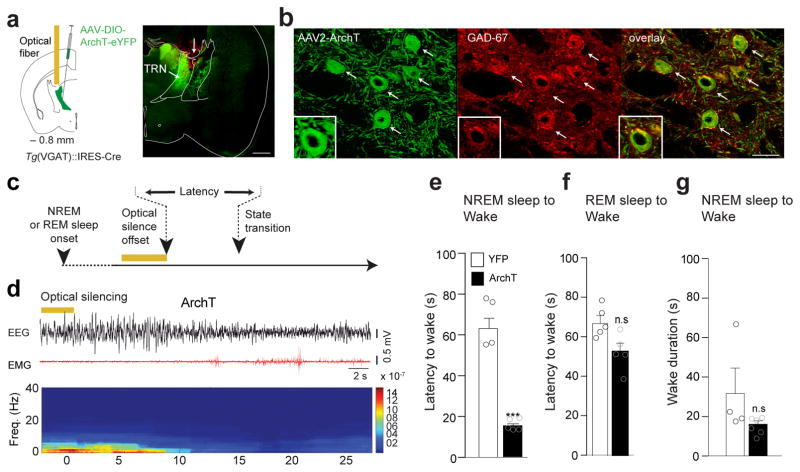
Figure 5. LHGABA-TRN induced arousal is due to direct inhibition of TRN cells.
a, Shematic (left) of the genetic targeting of TRNGABA neurons. AAVdj-DIO-ArchT-YFP or AAVdj-DIO-YFP were infused into the TRN of VGAT::Cre animals. Representative photomicrograph (right) of a coronal hemi-section showing ArchT-YFP expressing TRN cells in the anterior TRN Arrow indicates the injection tract. Scale bar, 500 μm. b, Representative photomicrograph magnification of the red box in panel (a). Scale bar, 50 μm. White arrows on the photomicrographs indicate ArchT-EYFP expressing TRN cells (green) positive for GAD-67+ (red) and merge images (right). Higher photomicrograph magnification shows colocalisation of EYFP and GAD-67 immunolabelling. Representative images from repeated experiment (> 15 sections from N = 5 transduced mice in each group). c, Schematic of the experimental timeline. d, Representative EEG/EMG traces and the corresponding heat map EEG power spectrum illustrating behavioral response to optogenetic silencing (bilateral 5-s continuous illumination, indicated by horizontal yellow bars; 593 nm) during NREM sleep. Note the decrease of the amplitude of low frequency (< 4Hz) oscillations and the EMG tone at NREM-to-Wake transition. e, f, Mean latencies ± S.E.M wake transitions during NREM (e) (ArchT N = 6, YFP N = 4, t=8.54 df=8, p=0.0001) and REM (f) sleep (ArchT N = 6, YFP N = 5, t=1.79 df=9, p=0.1073) after a single 5s-continuous illumination. Data analysis based on > 10 stimulations per frequency, per state and per animal (N). ***, P < 0.0001 ; n.s., P = 107 using unpaired two-tailed Student’s t-Test. g, Mean wake duration ± S.E.M upon optogenetic silencing of TRN cells during NREM sleep in control (white) and ArchT (black) mice( ArchT N = 6, YFP N=4, t=1.49 df=8, P=0.1753). n.s., P = 0.184 using a two-tailed Student’s t-Test.

