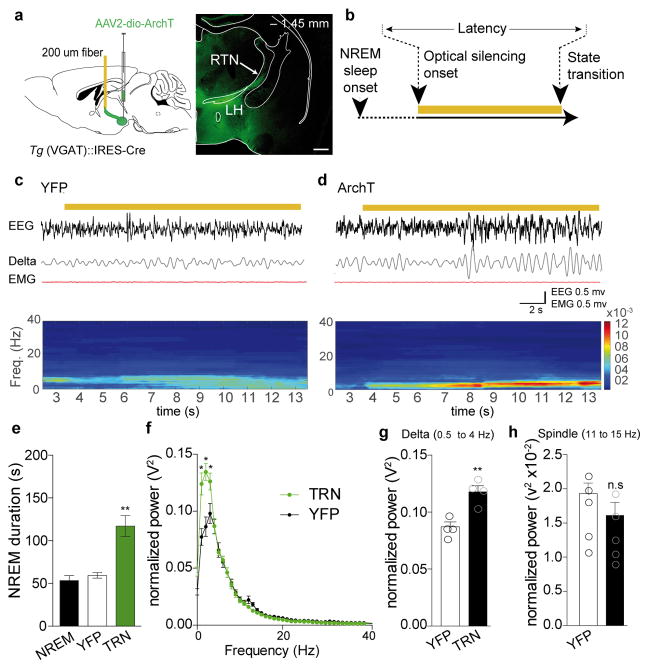
Figure 6. Inhibition LHGABA projections to the anterior TRN during NREM causes increase in total length of NREM sleep compare to control conditions.
a, Schematic of experimental preparation (left). AAV2-DIO-ArchT-EYFP and AAV2-DIO-EYFP (control) were infused in the LH (AP: −1.45 mm) of Tg(VGAT)::IRES-Cre animals. Bilateral fibers were implanted at the level of the anterior TRN (AP: −0.85 mm). Right, Photomicrographs of a coronal brain hemisection showing EYFP labelling of LH cell bodies targeting and projections to the TRN. b, Schematic of the experimental timeline. Light was delivered continuously 10 s after of the onset of a stable NREM sleep and terminated at the next transition (REM or wake). Representative images from repeated experiment (> 10 sections from n = 4 transduced mice in each group). c, d, Representative EEG/EMG traces and EEG heat map of control (EYFP, c) and ArchT-EYFP (d) animals showing changes in the EEG (top) delta (0.5–4 Hz) oscillation (middle), EMG and correspondent heat map EEG power spectrum (bottom) in response to local optical silencing (yellow bar, 593 nm) of LHGABA-TRN circuit during NREM sleep. e, Mean duration ± S.E.M of NREM sleep episodes during baseline (left, grey bar), and during optogenetic inhibition in control (white) and ArchT-EYFP (black) mice (N = 4 per group; Data analysis based on > 10 stimulations per frequency and per animal during NREM sleep episode. T(3,12)=21.45, P=0.00001) **, P < 0.01 using one-way multiple ANOVA followed by Bonfferoni post-hoc test. f, Mean ± S.E.M average of normalized spectral power distribution of relative cortical EEG power density in control animals (grey trace) and ArchT-EYFP (black trace) animals (n = 5 NREM episodes per animal. n=4 animals per group, t=0.239 df=484, P=0.811) upon optical silencing. *, P < 0.05 using unpaired two-tailed Student’s t-Test between control and ArchT animals. g, Quantification of the relative cortical EEG power of delta (n=4 mice per condition, N = 5 NREM episodes per animal, t=4.42, P=0.0052, unpaired two-tailed Student’s t-Test); **, P < 0.05) (h) and spindle frequencies upon optogenetic silencing of EYFP and ArchT-EYFP animals during NREM sleep (N = 4 mice per condition, N = 5 NREM episodes per animal, t=1.16, P=0.28); n.s., P < 0.28 using unpaired two-tailed Student’s t-Test.

