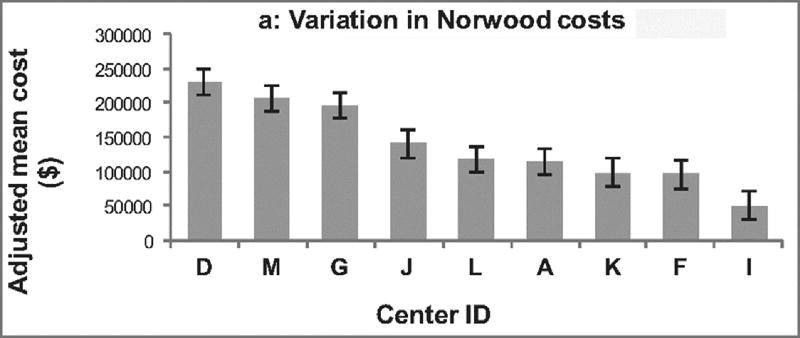
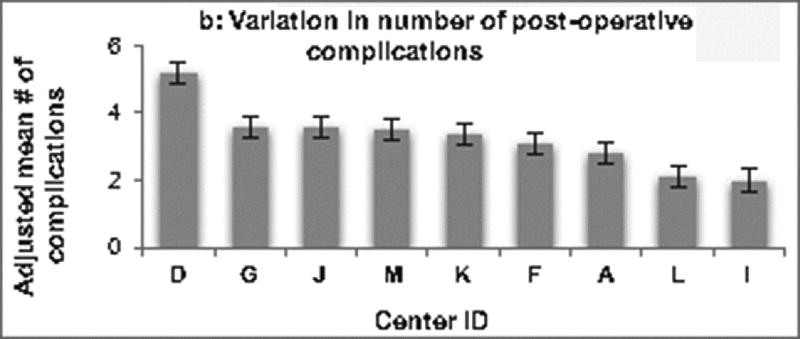
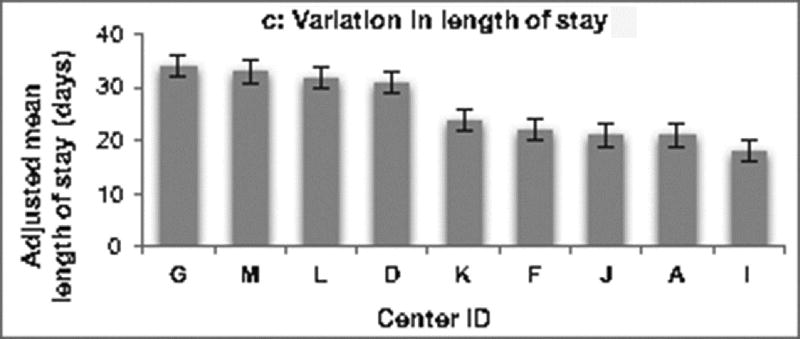
Figure 1.
Variation across centers. Centers are displayed in descending order. (A) demonstrates variation in adjusted hospital costs across centers for the Norwood operation. Hospital costs adjusted for baseline patient characteristics varied 4.6 fold across centers (p <0.001). (B) Variation in the adjusted number of post-operative complications across centers is depicted. There was 2.6 fold variation across institutions (p = 0.004). (C) Shows the variation across centers in adjusted post-operative length of stay, which varied 1.9 fold across centers (p < 0.001).


