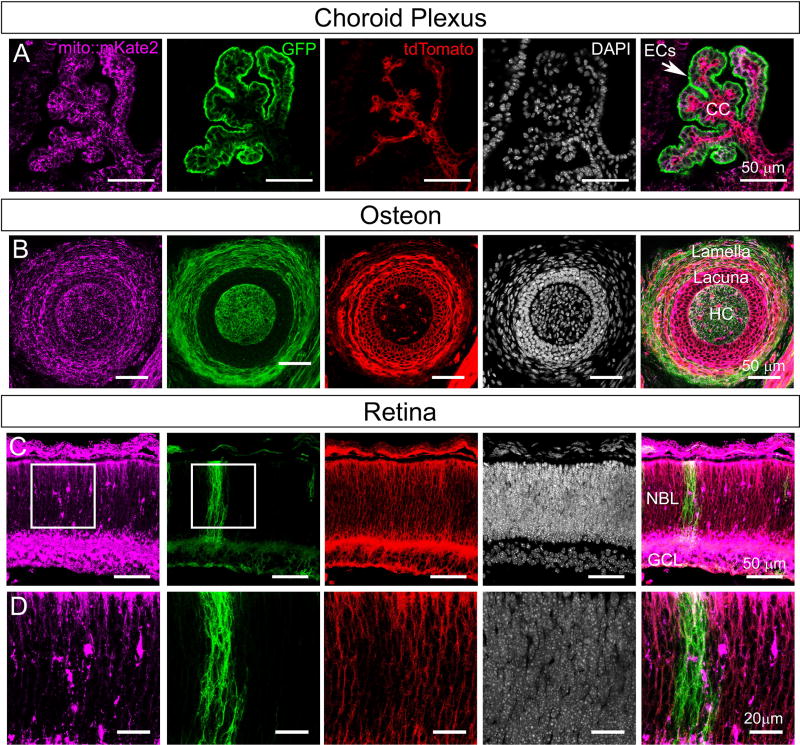
Figure 4. Mito::mKate2 fluorescence can be spectrally separated from the ROSA26R-mTmG dual fluorescent Cre reporter.
Postnatal day 0 head cryosections from Pdgfrα-Cre+/tg; ROSA26R-mTmG+/tg; mito::mKate2+/tg mice showing distinct mKate2, GFP and tdTomato fluorescent signals in the choroid plexus (A), osteon (B), and retina (C–D). EC= Ependymal Cells, CC= Choroid Capillaries, HC= Haversian Canal, NBL= Neuroblastic Layer, and GCL= Ganglion Cell Layer. n = 3. See text for details.

