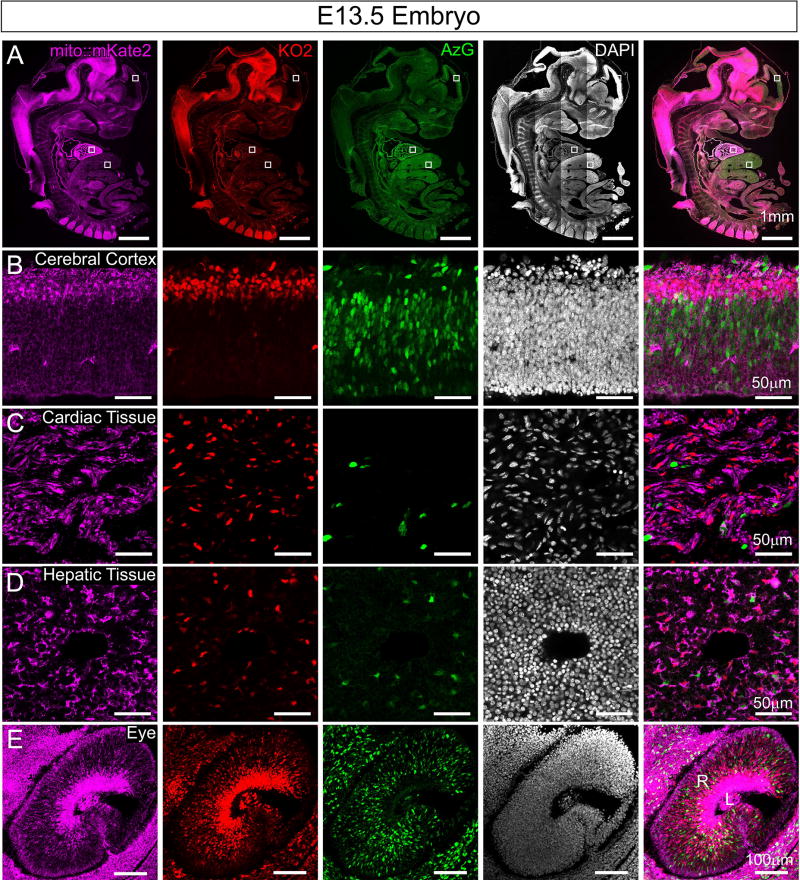
Figure 5. Mito::mKate2 fluorescence can be spectrally separated from the Fucci cell cycle reporter.
E13.5 embryo cryosections from Fucci-AzG+/tg; Fucci-KO2+/tg; mito::mKate2+/tg mice highlighting distinct fluorescence signals in the mKate2, KO2 and AzG channels throughout the embryo (A). High magnification images of the cerebral cortex (B), heart (C), liver (D) and eye (E). R= Retina and L = Lens. n = 3. See text for details.

