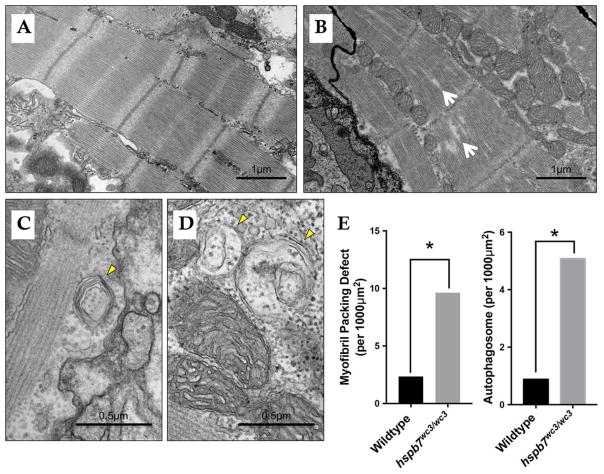
Fig. 6. Evidence of abnormalities in hspb7WC3/WC3 adult hearts by TEM.
Shown are representative transmission electron microscope images of 18 month (A) wildtype and (B) hspb7WC3/WC3 mutant hearts. Wildtype hearts exhibit repeated, regular sarcomeric striations with organized mitochondria. The hspb7 mutant heart tissue shows defects representing breakdown of sarcomeric organization (myofibril packing defects, white arrows). (C and D) Shown are two representative images of hspb7 mutant hearts that also exhibit increased number of autophagosomes (yellow arrowheads). (E) Graphs show quantification of relative occurrence rate (averaged number of defects over the total imaged area) of myofibril packing defects and autophagosomes in the wildtype and hspb7 mutant hearts (n=3 independent hearts for each). The difference in the rate of each defect was determined using an Exact Poisson test in R.

