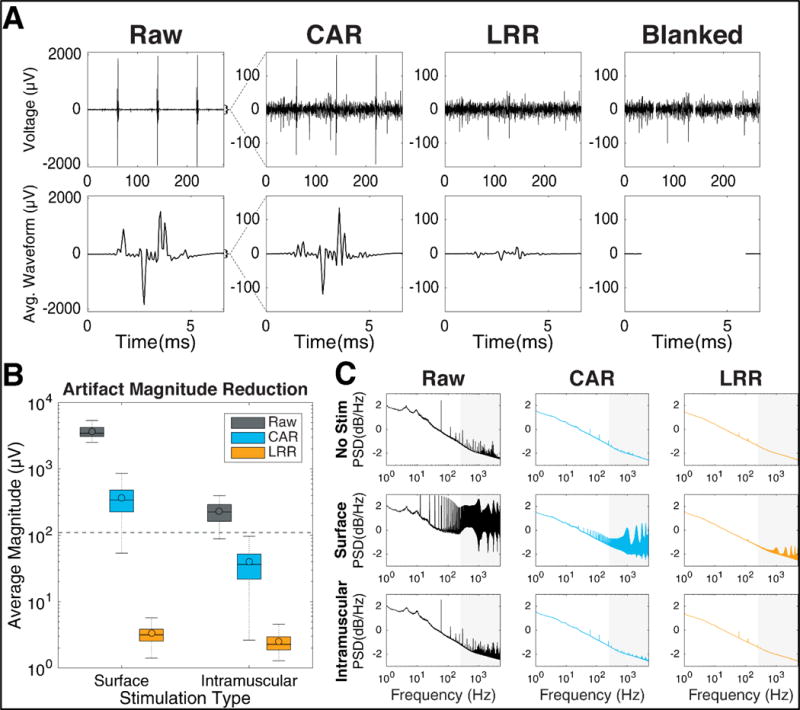
Figure 5.

Artifact reduction performance (A) Artifact magnitude reduction illustrated for a representative channel. [Top] Neural recordings made during surface stimulation after artifact reduction and bandpass filtering. Note the larger y-axis in the raw subplot, and the reduced artifact amplitudes after artifact reduction. The blanked trace removes 5ms of data during stimulation. [Bottom] Averages of 1000+ stimulation events for each reduction technique. During blanking, no signal is shown. (B) Distribution of the artifact magnitudes for each stimulation and artifact reduction condition during single-electrode stimulation blocks. Data includes one point per channel (192 total) per block (6 surface and 4 intramuscular blocks). Colored bars represent the interquartile range, horizontal lines represent the median, colored dots represents the mean, and dotted lines extend to the maximum and minimum non-outlier values (defined as points outside 1.5× the inter-quartile range). (C) Neural frequency content after artifact reduction as quantified by power spectral density curves, calculated on the continuous recordings before (Raw) and after CAR and LRR cleaning. PSD curves were averaged across all channels on one array for one non-stimulation block and three blocks each of surface and intramuscular stimulation. The grey background represents spike band frequency range (250-5000Hz).
