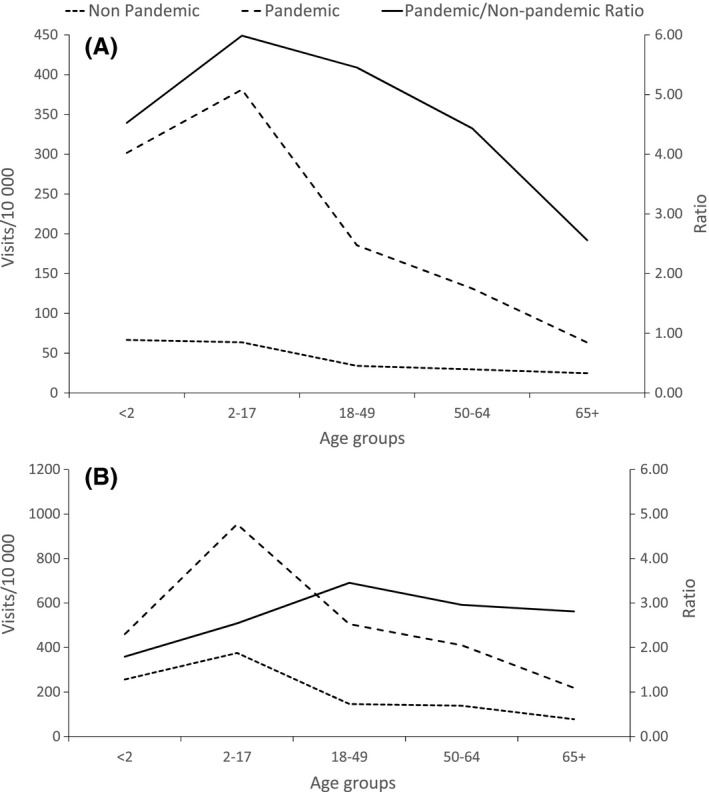
Figure 1.

Estimated rates of outpatient visits in 6 US healthcare delivery organizations (by age group) per 10 000 person‐years (left y‐axis) for influenza‐associated pneumonia and influenza (Panel A) and respiratory diseases (Panel B); and pandemic‐to‐pre‐pandemic rate ratios (right y‐axis): solid line, rate ratio; dashed line, pandemic rate; and dotted line, pre‐pandemic rate
