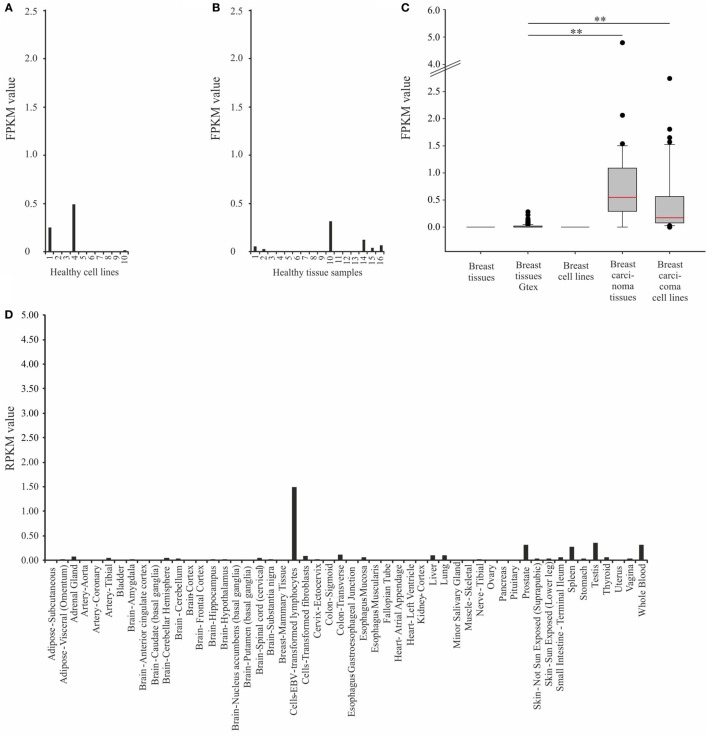
Figure 2.
Expression analysis of OR2B6 in healthy tissue samples and cell lines. (A) Expression of OR2B6 in ten healthy cell lines originated from different human tissues. For further details see Table S2 in Supplementary Material. (B) Expression of OR2B6 in 16 different human tissues, origin: BodyMap Project (26). (C) Box-plot showing the expression of OR2B6 in normal breast tissues and breast carcinoma tissues and cell lines. Breast tissue: normal breast tissue samples, n = 7; breast tissue GTEx: normal breast tissue samples originated from GTEx database, n = 214; breast cell lines: cell lines originated from normal breast tissues, n = 4; breast carcinoma tissues: carcinoma breast tissue samples, n = 21; and breast carcinoma cell lines: cell lines originated from breast cancer tissues, n = 45. Normality test (Shapiro–Wilk) failed, Kruskal–Wallis one-way ANOVA: p < 0.05; the statistical significance is indicated as follows: **p < 0.01. Red line represents the median value. (D) Expression of OR2B6 in 52 healthy tissues originated from the GTEx database.

