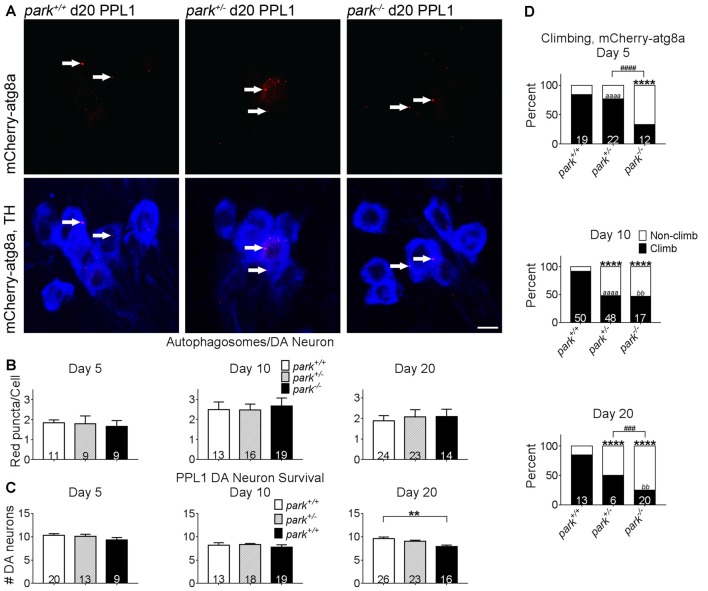
Figure 6.
Exogenous expression of atg8a in TH-producing neurons does not ameliorate DA degeneration or climbing deficits in park mutant flies. Brains of flies expressing the mitoGFP and mCherry-atg8a constructs in TH-producing cells were dissected, stained for TH (blue), and fixed on days 5, 10 or 20 PE. Images in (A) are digital sums of representative z-stacks for day 20 park+/+, park+/−, park−/− PPL1; digital image enhancement steps were standardized for the mCherry (red) fluorophore. Using standardized image capture and digital image analysis parameters, we identified and counted the number of atg8a puncta (white arrows) within TH-labeled regions and divided that value by the number of TH-positive cells for one PPL1 region per brain (B). We also counted the number of TH-positive cells per cluster (C). (D) Climbing assays were performed by placing individual flies expressing mitoGFP and mCherry-atg8a into polycarbonate tubes; the fly’s position in the tube was recorded each second for 20 min. The total distance climbed during the 20-min recording period was measured, and divided by number of climbs to calculate the average height climbed. A receiver operating characteristic (ROC) curve was generated from mitoGFP, mCherry-atg8a control fly climbing data to distinguish “climbing” from “non-climbing” flies. Numbers in histogram bars indicate the number of PPL1 regions analyzed for (B,C); for (D), number in histogram bars represent the number of flies tested. For ** and bbP < 0.01; for ###P < 0.001; ####P < 0.0001; for **** and aaaaP < 0.0001. Error bars represent standard error of the mean; scale bar represents five microns.

