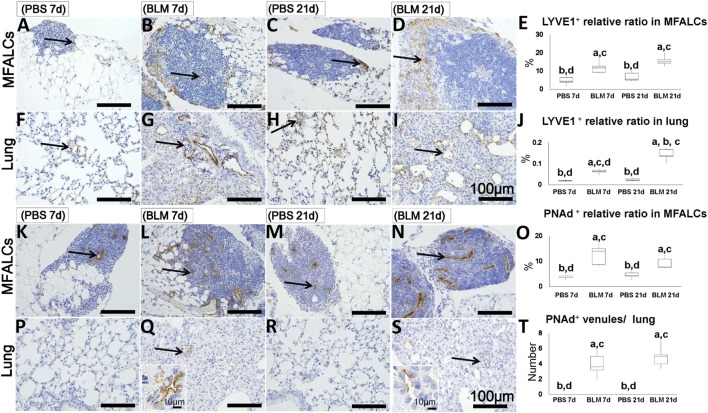
Figure 6.
Presence of LVs and high endothelial venules (HEVs) in mediastinal fat-associated lymphoid clusters (LCs) (MFALCs) and lungs of Bleomycin (BLM)-induced pneumonitis in mice. Immunohistochemical images depict LYVE1+ LVs in MFALCs (A–D) and lung tissues (F–I) in phosphate-buffered saline (PBS) group at 7 days, BLM group at 7 days, PBS group at 21 days, and BLM group at 21 days, respectively. Arrows indicate LYVE1+ LVs in MFALCs (A–D) and lung tissues (F–I). Percentage of LYVE1+ LVs in MFALCs (E) and lung tissues (J) of different groups. Immunohistochemical images of PNAd+ HEVs in the MFALCs (K–N) and lung tissue (P–S) are shown for PBS group at 7 days, BLM group at 7 days, PBS group at 21 days, and BLM group at 21 days, respectively. Arrows indicate PNAd+ HEVs in MFALCs (K–N) and lung tissues (P–S). (O) Relative ratios of PNAd+ HEVs in the MFALCs. (T) Average number of PNAd+ HEVs in lung tissues. The letters a, b, c, and d: significant differences between PBS group at 7 days (a), BLM group at 7 days (b), PBS group at 21 days (c), and BLM group at 21 days (d), analyzed by the Kruskal–Wallis test, followed by the Scheffé’s method (P < 0.05); n = 5 in each experimental group. Values = mean ± SE.

