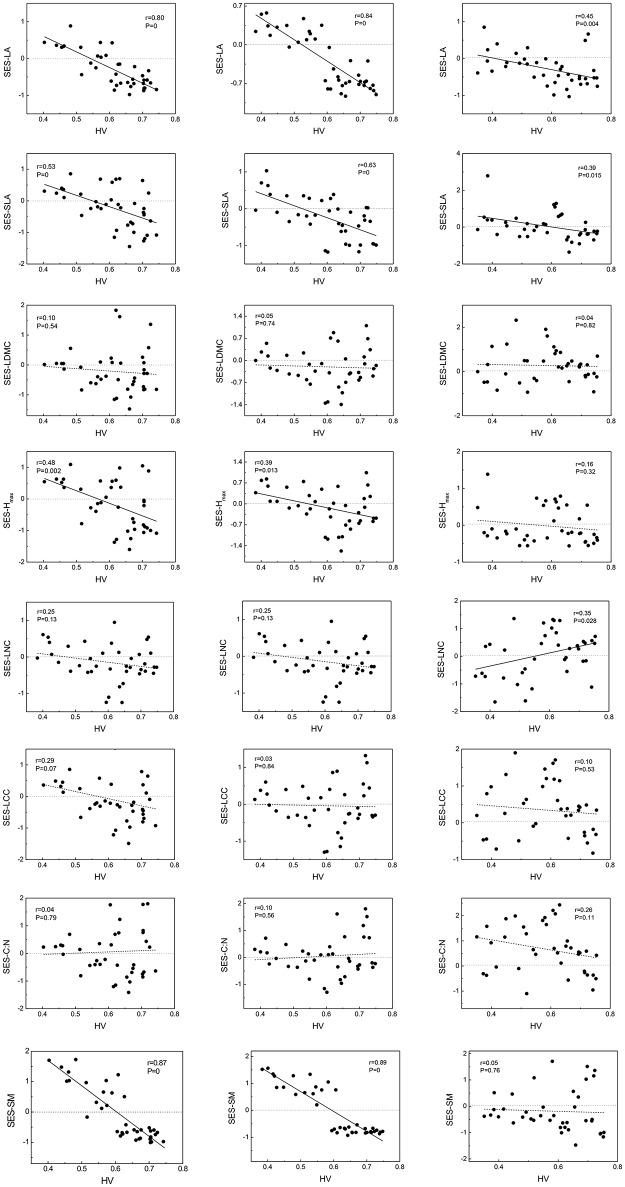
Figure 1.
Standardized effect sizes (SES) of traits vary along habitat-severity values (HV) gradient. Graphs on left column represent woody species level, graphs on right column represent herbaceous species level, and graphs on central column represent community level. Solid straight lines in graphs mean fit lines which p < 0.05; dash lines in graphs mean fit lines which p > 0.05. Dot lines locate on 0-level represent patterns of null expectation. LA, leaf area; SLA, specific leaf area; LDMC, leaf dry mass content; Hmax, the max plant height; LNC, leaf Nitrogen content; LCC, leaf Carbon content; C:N, leaf Carbon-Nitrogen ratio; SM, seed mass, same in below.

