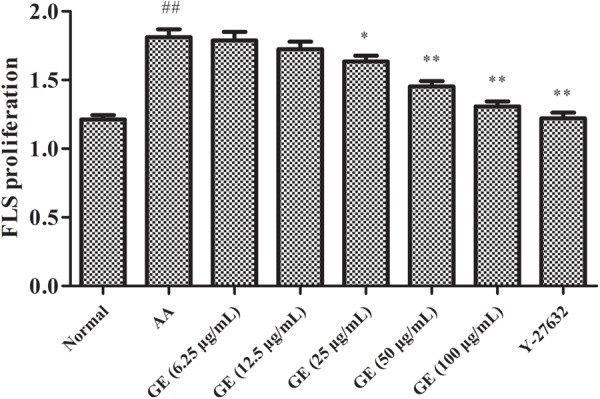
FIGURE 3.

Effects of different concentrations of GE on the proliferation of FLSs on AA rats in vitro (n = 3). Data were obtained from three independent experiments and are expressed as the mean ± SD. ##P < 0.01 vs. control group; ∗P < 0.05, ∗∗P < 0.01 vs. AA group.
