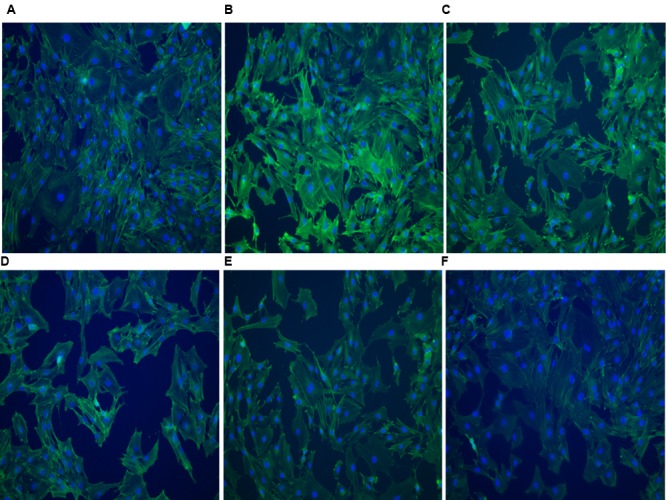
FIGURE 6.

Immunofluorescence images of F-actin of FLSs in AA rats (n = 3) (200×). FITC-phalloidin labeled F-actin showed green fluorescence and DAPI-labeled nuclei showed blue fluorescence. (A) Normal group, (B) AA group, (C) GE (25 μg/mL) group, (D) GE (50 μg/mL) group, (E) GE (100 μg/mL) group, (F) Y-27632 inhibitor group (10 μM).
