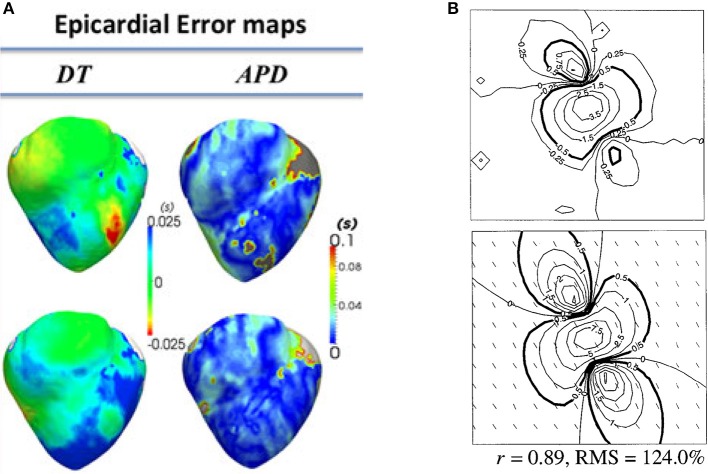
Figure 4.
Examples of quantitative validation of organ-level models. (A) Error maps (i.e., difference between model and experiment; here optical mapping-derived experimental data) for depolarisation time (DT) and APD (top row—pacing on left ventricle epicardium; bottom row—pacing on right ventricular endocardium) (Reproduced with permission from Relan et al., 2011). (B) Experimentally measured extracellular potential in mV using electrode plaque (top) compared to predictions of extracellular potential from bidomain simulations (bottom), with difference quantified using Pearson's correlation coefficient (r) and root mean squared (RMS) error. (Reproduced with permission from Muzikant et al., 2002).

