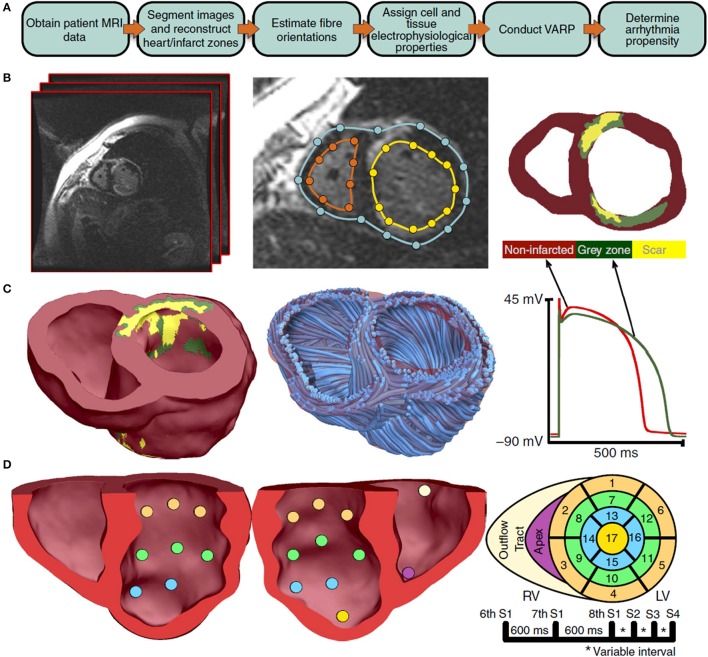
Figure 5.
Overview of process used to predict sudden cardiac death risk in Arevalo et al. (2016). A flowchart of the pipeline is shown in sub-figure (A). MR images are segmented [sub-figure (B)] to develop a patient-specific computational model which includes regions of scar tissue and border zone (“gray zone”) [sub-figure (C)]. A rule-based approach is used to specify fiber directions. The model is paced from 19 sites [sub-figure (D)] and with various pacing protocols and assessed for whether ventricular tachycardia is inducible. (Reproduced from Arevalo et al., 2016 with permission under Creative Commons license).

