
FIGURE 1.
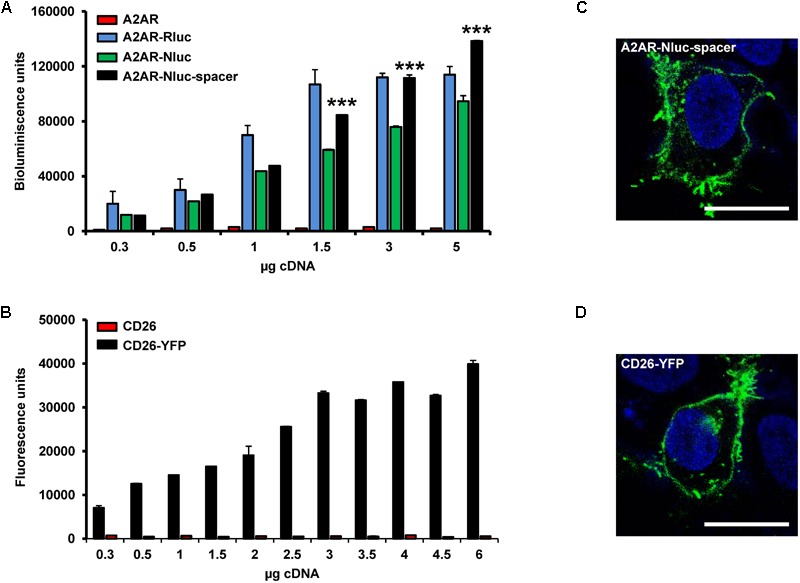
Expression of A2AR and CD26 fusion proteins. (A) Bioluminescence assays were performed in HEK-293T cells transfected with increasing concentrations of fusion protein cDNA corresponding to A2AR (red), A2AR-Rluc fused on the C-terminal end (blue), A2AR-Nluc fused on the N-terminal (green) or A2AR-Nluc-spacer fused on the N-terminal end (black) on the N-terminal end. Results are given in relative bioluminescence units by subtracting the value of non-transfected cells and represent mean ± SEM (n = 6). Statistical significance was calculated by one-way ANOVA followed by a Bonferroni multiple comparison post hoc test; ∗∗∗p < 0.001 against A2AR-Nluc. (B) Fluorescence assays were performed in HEK-293T cells transfected with increasing concentrations of CD26 (red) or CD26-YFP fused on the C-terminal end (black). Results are given in relative fluorescence units by subtracting the value of non-transfected cells and represent mean ± SEM (n = 10). (C,D) Confocal microscopy images from immunofluorescence experiments using HEK-293T cells transfected with 0.75 μg of A2AR-Nluc-spacer fused on the N-terminal end (C) or 1 μg of CD26-YFP fused on the C-terminal end (D) are shown. Immunocytofluorescence experiments were carried out with anti-A2AR primary antibody (1:100; Millipore) and goat anti-mouse Alexa Fluor 488 (1:300; Invitrogen) as secondary antibody. YFP-fused proteins were identified by their own fluorescence. A2AR-Nluc-spacer and CD26-YFP are labeled in green. Nuclei are colored in blue by DAPI staining. Scale bar: 20 μM.