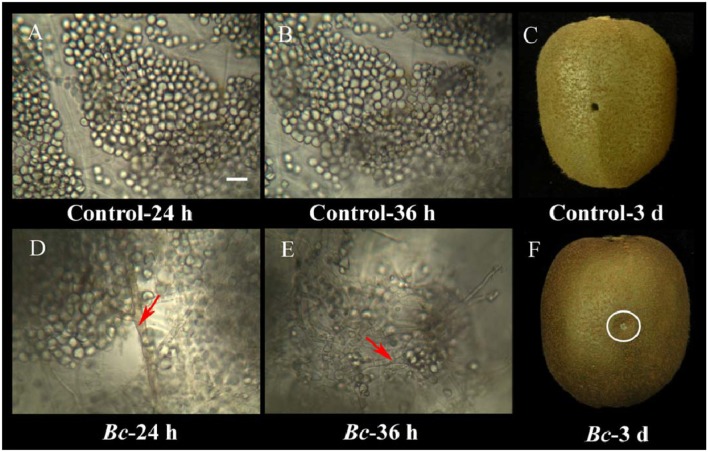
Figure 2.
Microscopic observations of the interaction between kiwifruit and B. cinerea during the early stages of the infection process. Control kiwifruit tissue (inoculated with sterile water) at 24 h (A) and 36 h (B), as well as whole fruit at 3 days post-inoculation (C). Kiwifruit tissue that had been inoculated with B. cinerea at 24 h (D) and 36 h (E), and whole fruit at 3-days (F). Red arrows indicate B. cinerea hyphae. The wound inoculated with B. cinerea is in the area within the white circle. Scale bar (–) represents 10 μm, and is applicable to (A–E).

