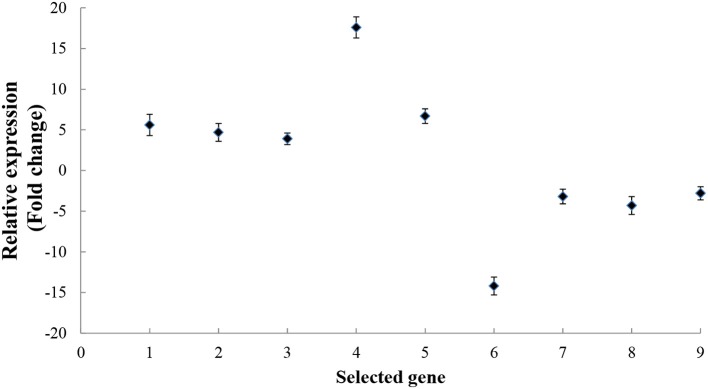
Figure 6.
RT-qPCR analysis of kiwifruit genes encoding proteins that either increased or decreased their level of accumulation in response to B. cinerea. The numbers from 1 to 9 on the x axis represent the following genes in order: Myosin 10 (Achn132881), Pectinesterase (Achn064441), Polygalacturonase-inhibitor protein (Achn126481), Pathogenesis-related Bet v I (Achn053521), Alternative oxidase (Achn228711), Germin-like protein (Achn331061), Annexin (Achn313711), Copper/zinc superoxide dismutase (Achn052701), and Thaumatin (Achn001821). Data presented are the mean ± SD of three independent experiments in which each experiment was comprised of three biological replicates for a total of n = 9.

