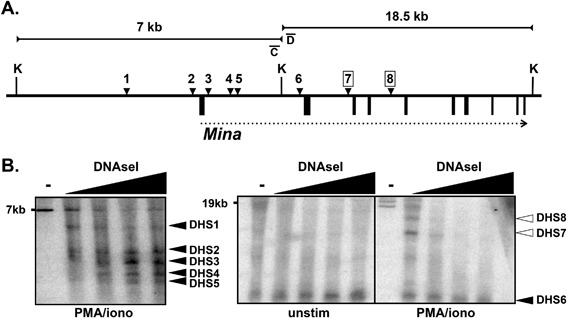
Figure 2.

DHS analysis of the Mina locus. (A) Shown is a schematic of the Mina locus (thick horizontal line), DHSs 1–8 (black downward arrowheads), exons 1–10 (black boxes below the thick horizontal line), the Mina transcription unit (horizontal dotted arrow) and 7 and 18.5 kb KpnI (K) fragments (horizontal lines with inward facing arrows; not shown to scale with respect to each other). Activation‐dependent DHS7 and DHS8 are boxed. (B) DHS analysis of EL4 cells activated for 16 h with PMA and ionomycin (PMA/iono) or not (unstim). After nuclei were treated with DNase I (wedges indicate increasing concentration; “‐” indicates no DNaseI control), genomic DNA was digested to completion with KpnI and analyzed by DNA blot with probe C (left) and probe D (right). Constitutive (filled arrowheads) and activation‐dependent (open arrowheads) DHSs are indicated to the right of each panel. Data are representative of two independent experiments with similar results.
