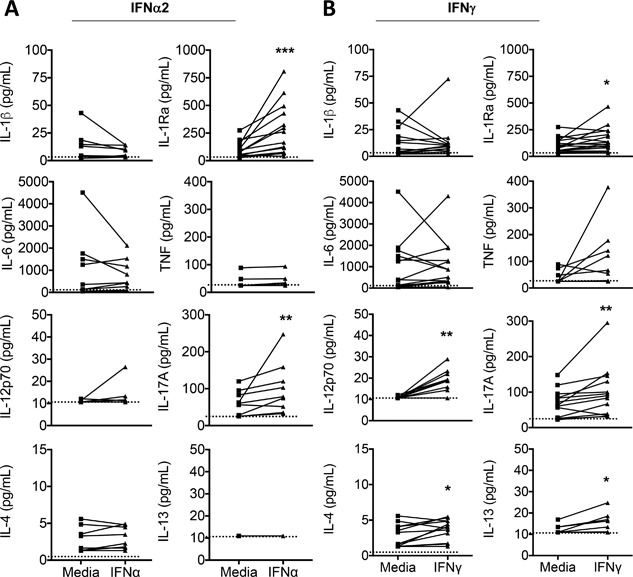
Figure 2.

CBMC secrete a distinct cytokine response following activation with type I or type II IFN. The profile of cytokine production by CBMC (106/ml) following 24 h activation with 100 IU/ml IFNγ (n = 17 for IL‐1Ra; n = 13 for all others) or 100 manufacturer U/ml IFNα2 (n = 13 for IL‐1Ra; n = 9 for all others) was determined using immunoassay. Each line depicts an individual CBMC sample. The limit of detection is depicted by hatched line. For statistical analysis, those samples with undetectable levels were assigned the limit of detection value. *p < 0.05, **p < 0.01, ***p < 0.001, ****p < 0.0001, Wilcoxon matched pairs signed‐rank test.
