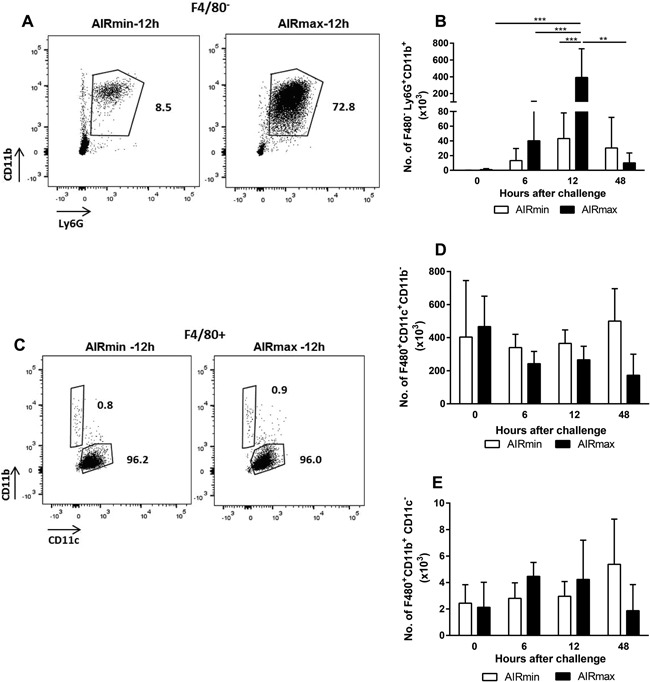
Figure 2.

Pneumococcal challenge induces the influx of neutrophils to the respiratory tract of mice with higher intensity in AIRmax mice. Animals (4 to 6 per group) were submitted to intranasal pneumococcal challenge with the ATCC6303 strain and were euthanized at different time‐points post‐challenge. Total cells from BALF were stained for the evaluation of neutrophils (A and B), AM (C and D), and EM (C and E) by flow cytometry. A and C are representative flow plots of the neutrophil (F4/80− CD11b+ Ly6G+) AM (F4/80+ CD11c+ CD11b−) and EM (F4/80+ CD11b+ CD11c−) populations, respectively, at 12 h post‐challenge. Numbers indicate the percentages inside the F4/80− (A) or the F4/80+ (C) populations. Graphs show total number of neutrophils (B), AM (D), and EM (E) in BALF at each time point post‐challenge. Results were expressed by means for each group with SD and are representative of two independent experiments. ***p < 0.001, Two‐way ANOVA, with Tukey's post‐test.
