
Figure 3.
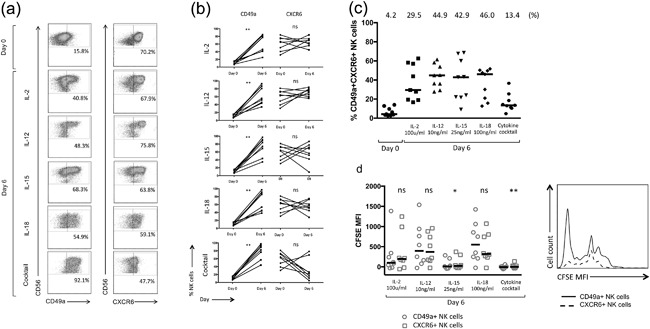
(a) Representative flow cytometry plots gated on NK cells, individual frequencies shown. (b) Percentage of CD49a+ and CXCR6+ NK cells in the peripheral blood at rest (day 0) and following incubation with IL‐2, IL‐12, IL‐15, IL‐18, and the cytokine cocktail (n = 8). Dot plots display individual values. (Wilcoxon matched pairs test). (c) Percentage of CD49a + CXCR6+ NK cells in the liver at rest (day 0) and following incubation with IL‐2, IL‐12, IL‐15, IL‐18, and a cytokine cocktail at day 6. Median percentages are shown. Dot plots display individual values. (d) Day 6 CFSE MFI of hepatic CD49a+ vs. CXCR6+ NK cells following culture with IL‐2, IL‐12, IL‐15, IL‐18, and the cytokine cocktail (n = 8). Dot plots display individual values and median (Wilcoxon matched pairs test). Representative flow cytometry histograms from one individual showing CFSE MFI of CD49a+ and CXCR6+ NK cells at day 6 following culture with IL‐15. p < 0.05*, p < 0.01**.