
Figure 4.
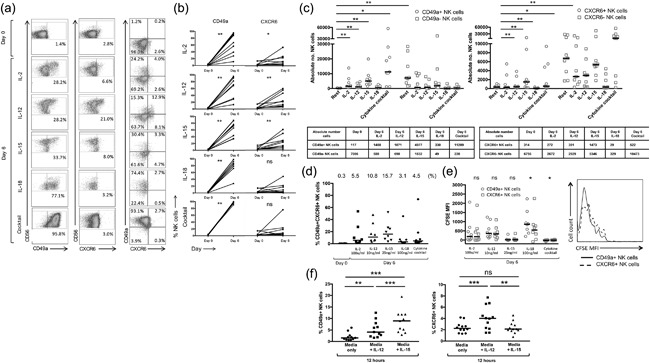
(a) Representative flow cytometry plots gated on NK cells, individual frequencies shown. (b) Percentage of CD49a+ and CXCR6+ NK cells in the peripheral blood at rest (day 0) and following incubation with IL‐2, IL‐12, IL‐15, IL‐18, and the cytokine cocktail (n = 9). Dot plots display individual values. (Wilcoxon matched pairs test). (c) Absolute number of CD49a± and CXCR6± NK cells at rest (day 0) and following incubation with IL‐2, IL‐12, IL‐15, IL‐18, and the cytokine cocktail. (n = 9). Dot plots display individual values. Median absolute cell numbers shown in table below. (d) Percentage of CD49a + CXCR6+ NK cells in the peripheral blood at rest (day 0) and following incubation with IL‐2, IL‐12, IL‐15, IL‐18, and a cytokine cocktail at day 6. Median percentages are shown. Dot plots display individual values. (e) Day six CFSE MFI of CD49a+ vs CXCR6+ NK cells in the peripheral blood following culture with IL‐2, IL‐12, IL‐15, IL‐18, and the cytokine cocktail (n = 8). Dot plots display individual values and median (Wilcoxon matched pairs test). Representative flow cytometry histograms from one individual showing CFSE MFI of CD49a+ and CXCR6+ NK cells at day 6 following culture with IL‐15. (f) Frequency of CD49a+ and CXCR6+ NK cells at rest and following a 12 h culture with media only, IL‐12 10 ng/ml, or IL‐15 25 ng/ml using purified NK cells (n = 12). Dot plots display median. (Wilcoxon matched pairs test). p < 0.05*, p < 0.01**, p < 0.001***.