
Figure 3.
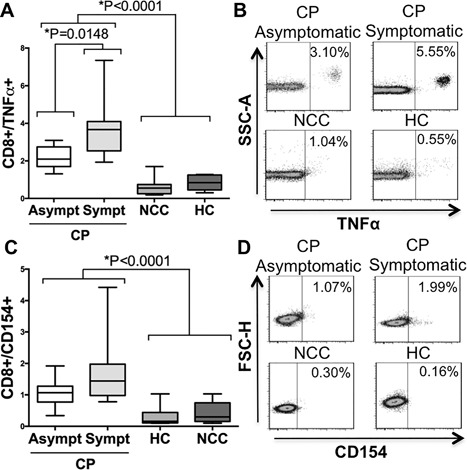
Membrane TNF‐α and CD154 expression on CD8+ T cells after T. cruzi antigen‐derived stimulus. Percentage of membrane TNF‐α+ expression for CD8+ lymphocytes in the analyzed groups (A). Examples of density/scatter plots for membrane TNF‐α (x‐axis) and CD8+ T cells (B). Percentage of CD154 expression for CD8+ T cells in the analyzed groups (C). Examples of density/scatter for CD154 (x‐axis) and CD8+ T cells (D). Box and whiskers indicate the median frequency and range of CD154 and membrane TNF‐α expression among CD8+ T cells (25th–75th percentile). CP, Chagasic patient; CP Asymptomatic, Asymptomatic Chagasic Patients; CP Symptomatic, Symptomatic Chagasic Patients; HC, Healthy Controls; and NCC, Non‐Chagasic Cardiomyopathy.