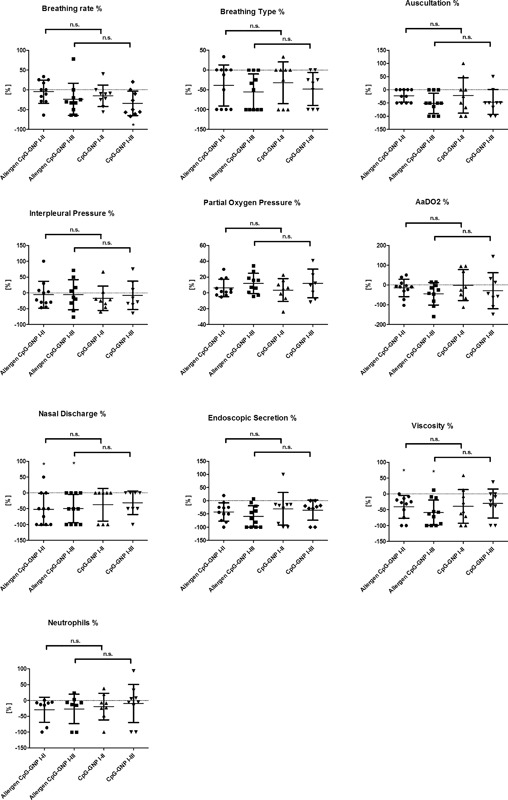
Figure 2.

Relative decrease or increase [%] of breathing rate and pattern (calculated value of P < 0.05 displayed as *; P < 0.01 as **; P < 0.001 as ***), lung auscultation, interpleural pressure measurement, oxygen partial pressure, AaDO2, percentage of neutrophils in TBS, nasal discharge, endoscopic quantification of secretion and viscosity depicted in percent between first and second (I–II) and first and third (I–III) examinations and in comparison between combined allergen and CpG‐GNP treatment group (n = 11 equine asthma‐affected horses) and pure CpG‐GNP (n = 9 equine asthma‐affected horses) group (mean ± SD).
