
Figure 4.
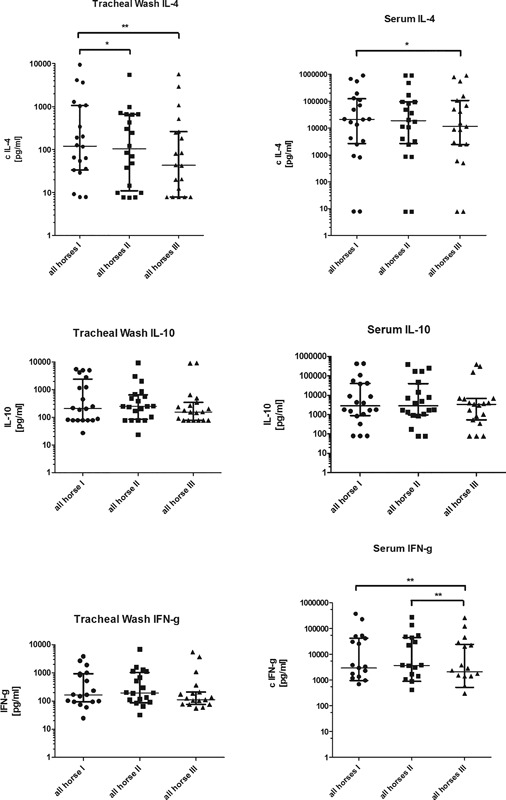
IL‐4, IL‐10, and IFN‐g concentration [pg/ml] in tracheal wash samples and serum of equine asthma‐affected horses at first (I) examination before inhalation treatment, after seven inhalations (II) and after 6 weeks without any treatment to evaluate ongoing effect (III). All horses (n = 20) independent of the group are depicted. Serum IFN‐g all horses: nine points are under detection limit. Tracheal wash IFN‐g: five points are under detection limit. Calculated value of P < 0.05 displayed as *; P < 0.01 as **; P < 0.001 as *** (individual values as scattered dot plot and median with interquartile range are depicted).