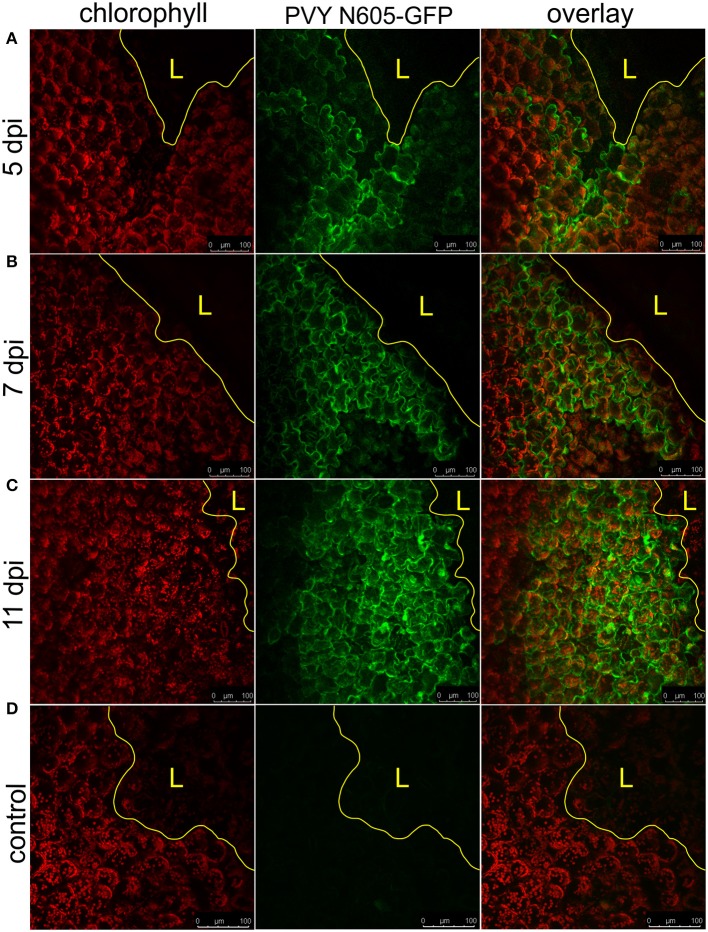
Figure 3.
PVY spread around the cell death zone in NahG-Rywal transgenic plants. Lesions at 5 dpi (A), 7 dpi (B), and 11 dpi (C) are shown. (D) Shows a lesion inoculated with PVY without GFP tag. From left to right: chlorophyll fluorescence (red), PVY N605-GFP accumulation (green), overlay of chlorophyll fluorescence and PVY N605-GFP accumulation. The number of the cells around the cell death zone in which PVY N605-GFP accumulation was detected was higher at later time points after inoculation. The lesion is marked by the yellow L and the edge of the cell death zone is marked by the yellow line. Scale bars are 100 μm.

