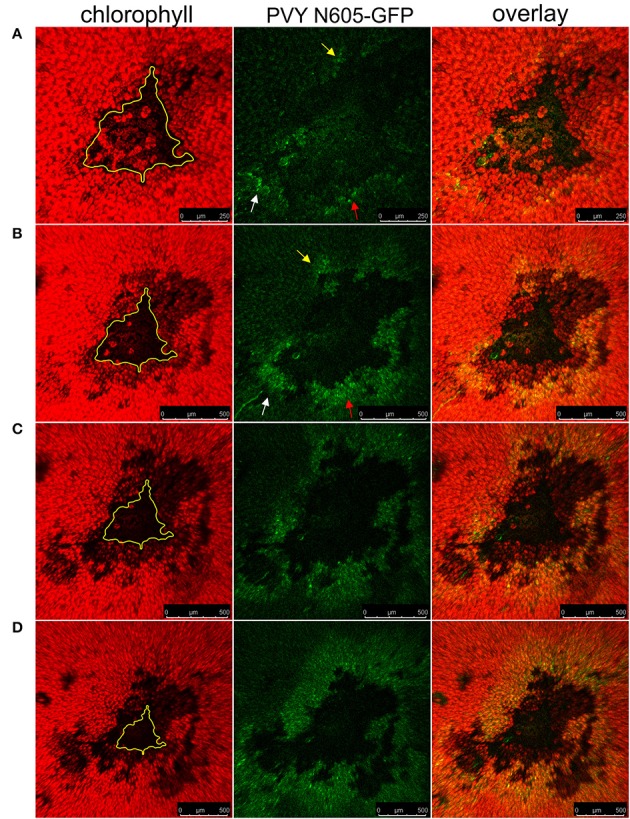
Figure 6.

The spread of the PVY following temperature shift in cv. Rywal. Plants were kept at 22°C to allow lesion formation. At 4 dpi, the inoculated leaf was detached, cut into pieces, placed on 1.5% (w/v) agar plate and kept at 22°C. At 4 dpi (A), 5 dpi (B), 6 dpi (C), and 7 dpi (D), the plate was transferred to 28°C for 2 h for confocal microscopy imaging. The higher temperature was used as a condition under which multiplication and spread of the virus are not inhibited by Ny-1 gene, while the lower temperature as a means to visualize the lesion expansion due to Ny-1 gene activity. From left to right: chlorophyll fluorescence (red), PVY N605-GFP accumulation (green), overlay of chlorophyll fluorescence and PVY N605-GFP accumulation. The number of GFP-containing cells around the cell death zone was higher at later time points after inoculation confirming the spread of the PVY N605-GFP. The size of the lesion at 4 dpi is indicated by the yellow line. Arrows indicate the development of secondary infection foci. Scale bars are 250 μm (A) or 500 μm (B–D).
