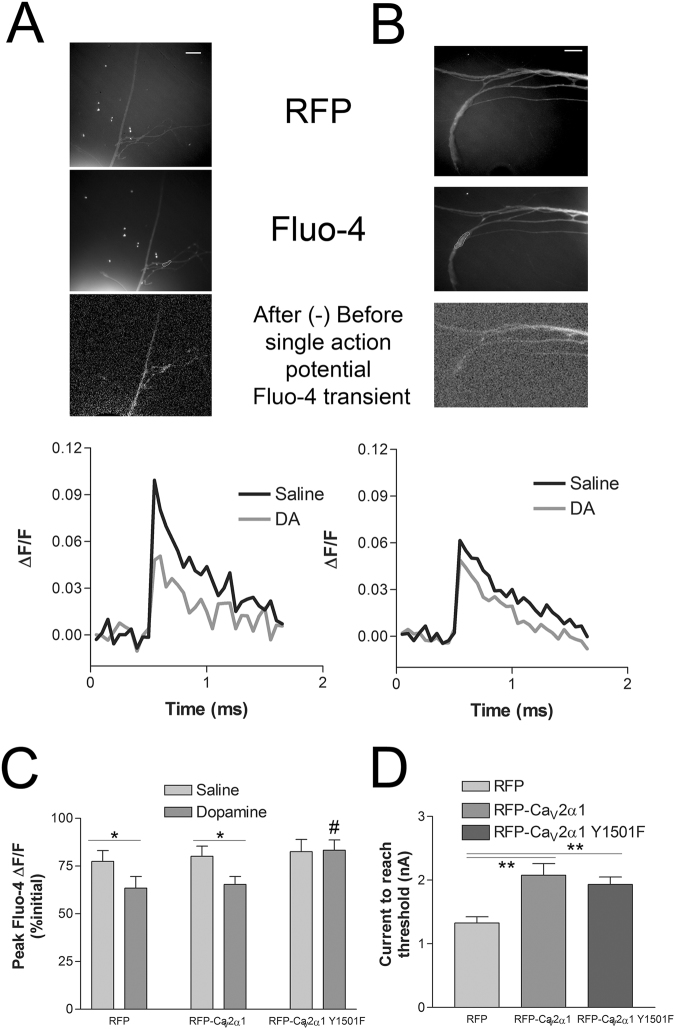
Figure 7.
Single action potential Fluo-4 transients before and after dopamine. (A,B) RFP image used to choose Fluo-4 ROI prior to Fluo-4 load (upper images) and Fluo-4 image following loading with ROI indicated (middle images), image subtraction of the frame prior to action potential generation and the frame after (lower images). Representative ΔF/F Fluo-4 fluorescence transients from the trials depicted in images above. Averaged three consecutive single action potentials evoked at 0.2 Hz before and 1 min after application of 10 μm dopamine with SNs expressing either RFP-CaV2α1 wt + CaVβ + CaVα2δ (A) or RFP-CaV2α1 Y1501F + CaVβ + CaVα2δ (B). Scale bars are 20 μm. (C) Average peak Fluo-4 fluorescence transients to single action potentials as a percentage of the previous peak transients to account for run-down in the calcium transient. Addition of 10 μm dopamine significantly reduced the average single action potential peak Fluo-4 transients with RFP and RFP-CaV2α1 wt + CaVβ + CaVα2δ expression, but not with RFP-CaV2α1 Y1501F + CaVβ + CaVα2δ, comparing before to after dopamine with paired t-tests (*P < 0.05, n = 13,13,12). The RFP-CaV2α1 Y1501F group was significantly different (P = 0.023) from the RFP alone controls using an one-way ANOVA F = 4.181 with Dunnett’s post test, #P < 0.05 (P = 0.953, comparing wt to RFP alone controls). (D) Initial SN membrane excitability for the neurons used in C. CaV2α1 over-expression as with either wt or Y1501F, but not RFP alone reduced membrane excitability, requiring more current to reach threshold with a 50 ms depolarizing pulse as in Fig. 3 (**P < 0.01, comparing wt (P = 0.001) and Y1501F (P = 0.003) to the RFP alone control with an one-way ANOVA F = 9.036 and Dunnett’s post test.

