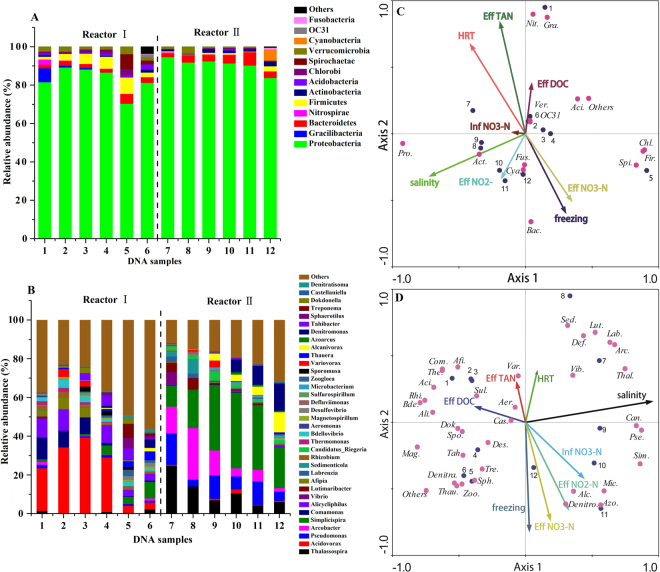
Figure 7.
The relative abundances of major bacterial groups at phylum (A) and genus (B) levels of the two reactors; The redundancy analysis between environmental factors and abundance of microorganism based on phylum (C) and genus (D) levels of the two reactors. (1–6 were stage I-VII except for Stage III for reactor I; 7–12 were stage I-VII except for Stage III for reactor II; Microbial community was represented by the first three or four letters of bacterium, such as Proteobacteria with Pro. for short).

