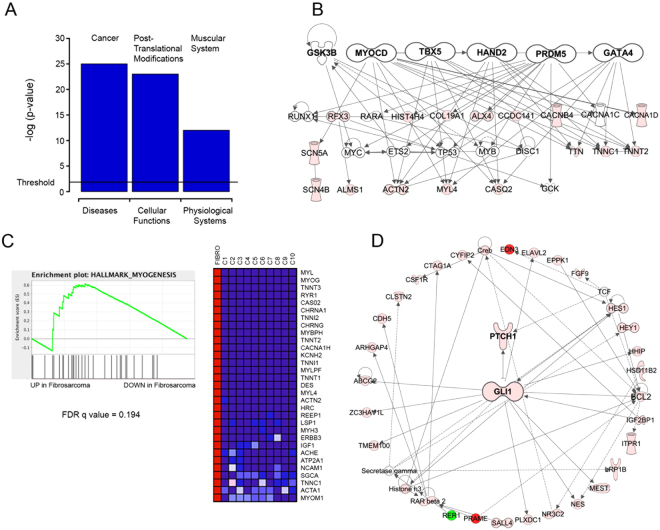
Figure 4.
Network analysis of expression data. (A) The top enriched function in each category is plotted with the log p-value. The significance threshold is marked. (B) Mesenchymal network derived from the upstream/master regulators found in the expression dataset. (C) Gene Set Enrichment Analysis (GSEA) of the mesenchymal hallmark signature. Left Panel: The enrichment score is compared with the up-regulated (left) and down-regulated (right) genes. The False Discovery Rate is also shown. Right Panel: The top regulated genes found in the analysis. Lighter gray, higher expression. Darker gray, lower expression. (D) The Hedgehog pathway is enriched in the ovarian fibrosarcoma sample. Gray tones represent expressional changes.

