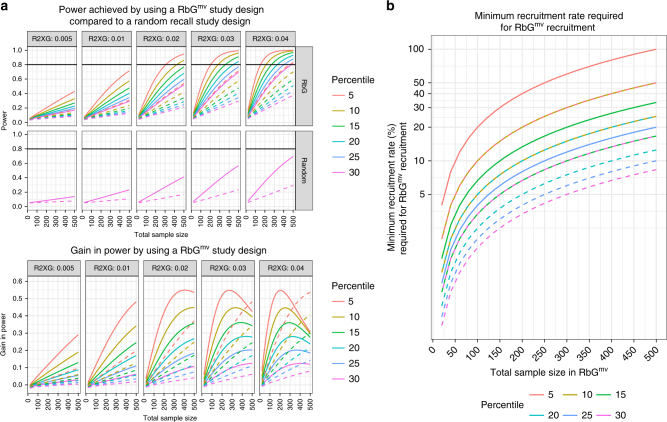
Fig. 4.
Comparative power: RbGmv versus random recall study design. a Top panel: A comparison of power (y-axis) achieved by an RbGmv study design versus a random sample selection design for a given (variance in exposure explained by the genetic risk score (GRS)) and percentile. The x-axis is the total sample size. Lower panel: A representation of the difference (y-axis) between the power within an RbGmv study design and that from the equivalent random recall experiment. In both the top and bottom panels, solid lines represent the situation where the variance in outcome explained by exposure () is equal to 0.3 and dashed lines represent the situation where is equal to 0.1. b An illustration of the minimum recruitment rate needed in order to recruit sufficient study participants for a given RbGmv study sample size (x-axis) and percentile. Solid lines represent the situation where the size of the genotyped cohort (or biobank) is equal to 5000 people and dashed lines represent the situation where the size of the genotyped cohort (or biobank) is equal to 10,000 people. For details of how the power calculations were carried out, see Supplementary Note 1. Here we use the analytical method and assume a Type I error rate (alpha) of 0.05 and equal-sized genotype groups. The ‘percentile’ is the threshold used to recruit from the GRS distribution in the genotyped cohort (or biobank) in the RbGmv study (e.g., percentile 5 corresponds to recruitment from the top and bottom 5%)

