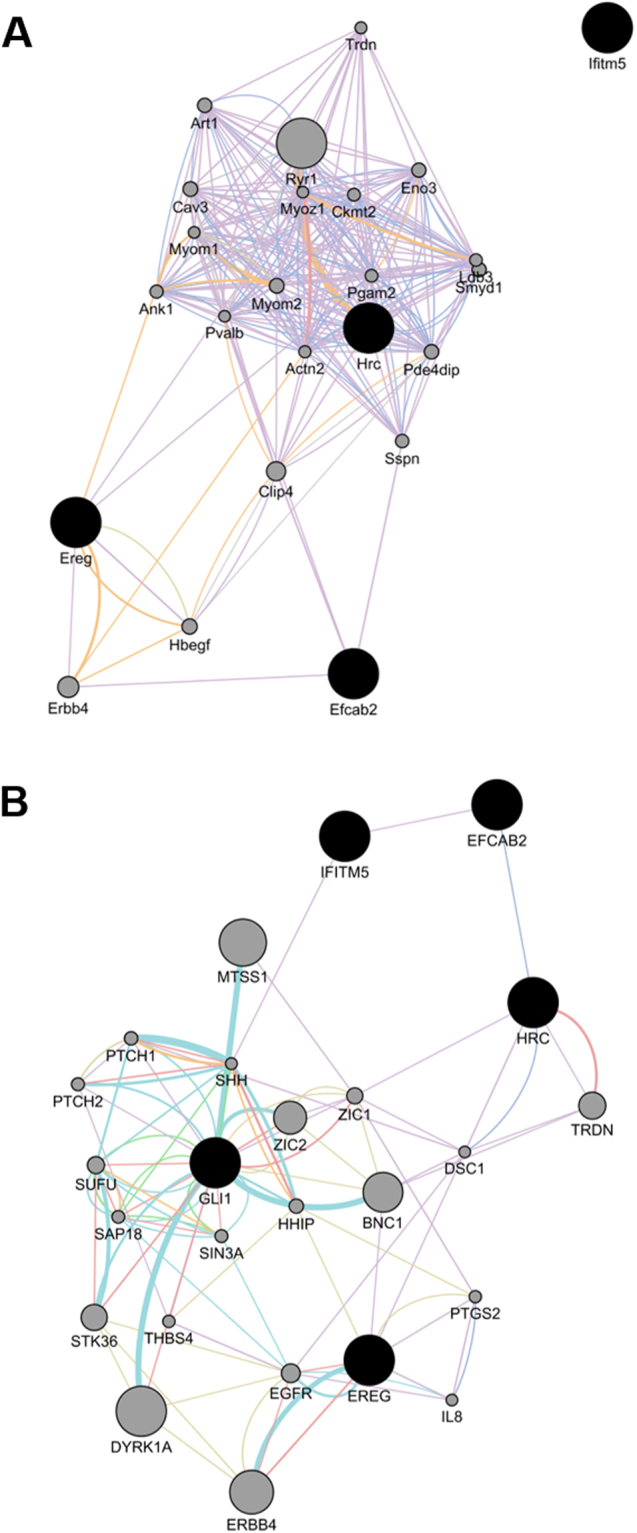
Figure 5.

Networks displayed by 3 up- (Ereg, Efcab2, and Katnal2) and 3 down-regulated genes (Hrc, Gli1, and Ifitm5) in genistein treated mouse osteoblastic cell line MC3T3-E1. GeneMANIA software was employed to generate networks to the mouse (A) or human (B) protein–protein interaction database. Violet, Pink, Orange, Turquoise, Blue, Yellow, and Green lines indicate Co-expression, Physical interactions, Predicted, Pathway, Co-localization, Shared protein domains, and Genetic interactions, respectively.
