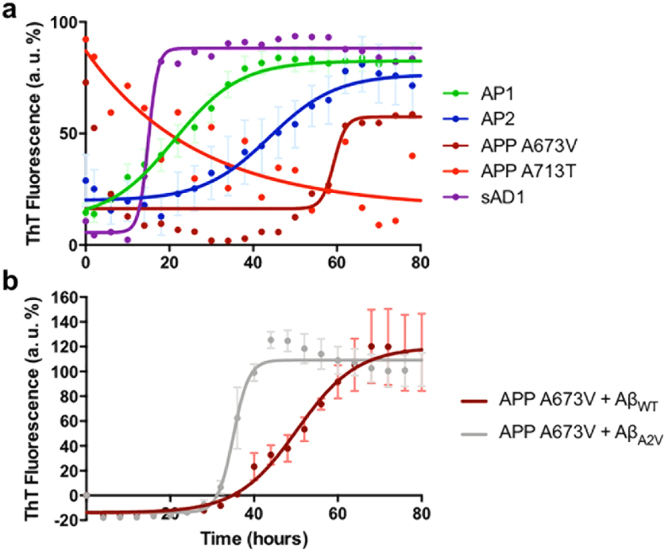
Figure 4.

RT-QuIC profiles of human brain extracts from the molecular subgroups of AD. Soluble fractions from AD brain homogenates were diluted in 100 mM Tris-HCl pH 7.5, 5 μM ThT, 4 μM Aβ1-42WT (panel a) or Aβ1-42A2V (panel and b). ThT intensity was normalized to the corresponding maximal ThT fluorescence and expressed as relative arbitrary units (a. u. %). Comparison of aggregation kinetics of brain extracts from AP1 and AP2 profiles and APPA673V, APPA713T and sAD1 subjects (a). Each brain sample was analyzed in quadruplicate. Data are shown as mean ± SEM. Comparison of aggregation kinetics of APPA673V brain extract when co-incubated with Aβ1-42 wild-type or Aβ1-42 carrying the A2V mutation, corresponding to A673V substitution on APP gene (b). Each brain sample was analyzed in triplicate. Data are shown as mean ± SEM.
