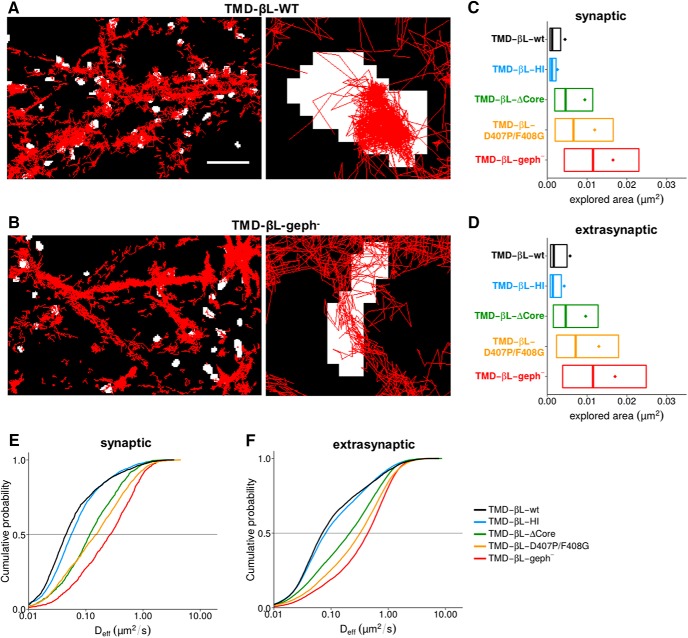
Figure 5.
Membrane diffusion of TMD-βL variants in spinal cord neurons. A, B, sptPALM was done using Dendra2-tagged TMD-βL variants in cultured neurons as described in Materials and Methods. Single molecule trajectories were recorded in 10,000 frames at an acquisition rate of 15 ms (red traces). Active synapses were identified using FM 4-64 labeling (binarized fluorescence images shown in white). Left, High-density sptPALM of dendritic segments expressing TMD-βL-WT (A) or the gephyrin binding-deficient construct TMD-βL-geph- (B). Right, Zoomed recordings showing confinement of TMD-βL-WT at synapses (A) as opposed to the high mobility of TMD-βL-geph- (B). Scale bar: 5 µm (left panels); pixel size of FM-labeled synapses: 160 nm (right panels). C, D, Comparison of the areas explored by the TMD-βL variants at synapses (C) and in the extrasynaptic compartment (D), represented by the mean value (colored dots), the median, 25% and 75% quartiles of the trajectories (boxes). Explored areas were normalized by the number of detections for each trajectory. Data were compared via one-way ANOVA (Kruskal–Wallis test) followed by a post hoc Dunn’s multiple comparison test: all pairs were significantly different from one another with p < 0.001. E, F, Cumulative histogram of diffusion coefficients of TMD-βL variants in spinal cord neurons. Diffusion coefficients at synapses vary according to the strength of βL-gephyrin binding (E). The variants display comparable diffusion behaviors at extrasynaptic locations (F). Data were compared with one-way ANOVA (Kruskal–Wallis test) followed by a post hoc Dunn’s multiple comparison test: for all pairs, Deff was significantly different with p < 0.001, except for TMD-βL-ΔCore versus TMD-βL-D407P/F408G at synapses with p > 0.05 (median values and quartiles with statistical comparison are given in Tables 1, 4).

