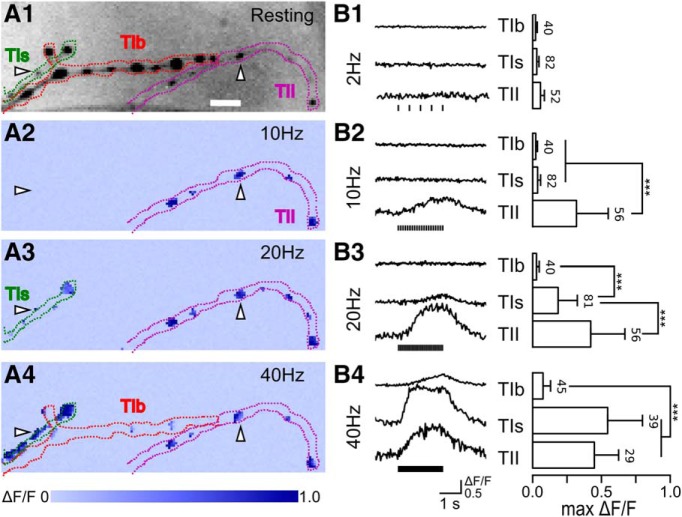
Figure 1.
Distinct frequency responses of the GCaMP signals in type Ib, Is, and II synapses. A1, Inverted-gray image showing the typical morphology of GCaMP expressing type Ib, Is, and II synaptic terminals in muscle 12. Their contours are traced in in red, green, and purple, respectively. Arrowheads indicate a type II bouton (right) and a type Is bouton (left). A2–A4, Pseudo-color maps of maximum change in ΔF/F (max ΔF/F) under 10-, 20-, and 40-Hz stimulation, respectively. Arrowheads and terminal contours are carried over from A1. B1–B4, left panels, Representative fluorescence ΔF/F traces and the corresponding right panels show summary bar plots of max ΔF/F for type Ib, Is, and II synaptic boutons from 8–11 NMJs at 2, 10, 20, and 40 Hz, respectively. The vertical scale bar indicates ΔF/F of 0.5 unit, i.e., 50% increase in fluorescence intensity. Error bars indicate SDs with numbers of boutons indicated. KW tests with Bonferroni corrections were performed. Asterisks indicate highly significant differences; ***p < 0.001. Ca2+ indicator GCaMP1.3 was used in this and the majority of the following figures, except for Figures 3, 5, 6, 8. These samples are included in the analysis of a greater data set presented in Table 1.

