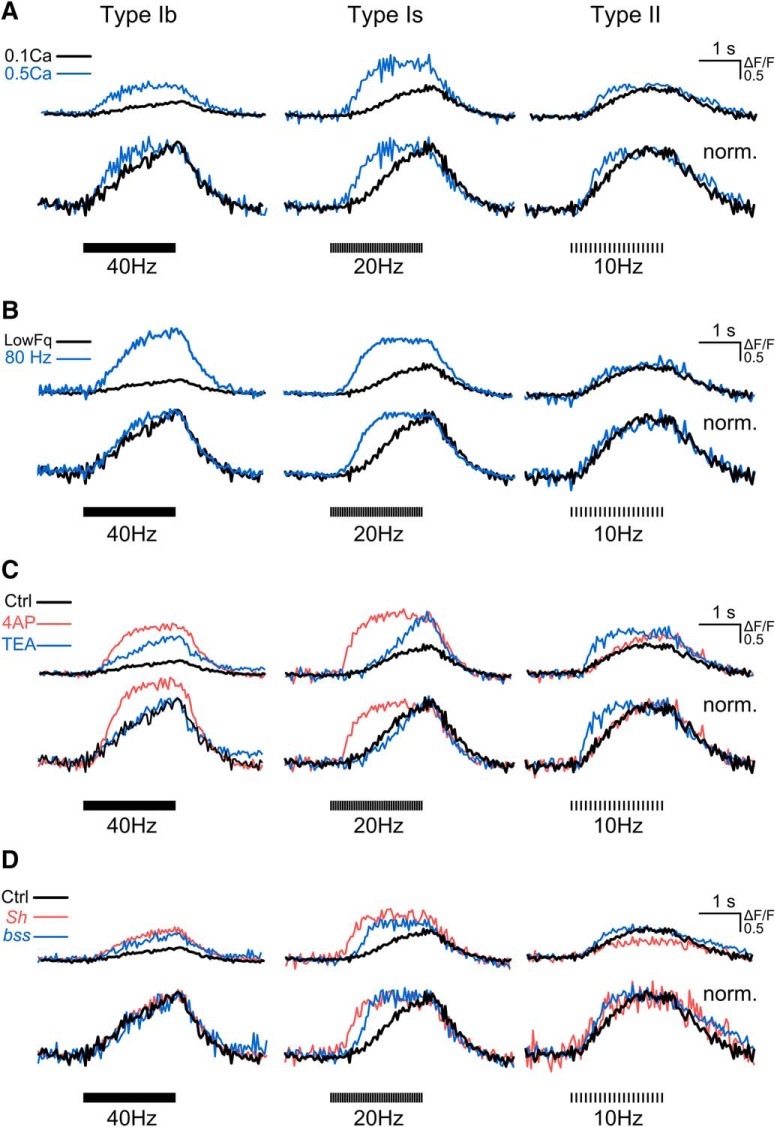
Figure 12.
Kinetic analysis of presynaptic GCaMP signals with different manipulations enhancing Ca2+ influx. Comparison of original (upper) and normalized (lower) ΔF/F traces collected from individual boutons of (A) WT with 0.1 mM Ca2+ (black) versus 0.5 mM Ca2+ (blue), (B) WT with 0.1 mM Ca2+ under the designated stimulation frequency (black, 40 Hz for Ib, 20 Hz for Is, and 10 Hz for II) versus 80-Hz stimulation (blue), and (C) WT control (black) versus 4-AP (200 µM, red) and TEA (10 mM, blue) treatments, 0.1 mM Ca2+. D, WT control (black) versus ShM (Sh, red), and bss1 (bss, blue). Type Ib, Is, and II synapses, stimulated at 40, 20, and 10 Hz, respectively, in 0.1 mM Ca2+. Note clear alterations in the rise kinetics with minimal effects in the decay kinetics indicated by superimposing normalized traces. See Tables 2, 3 for ensemble data of rise and decay kinetics.

