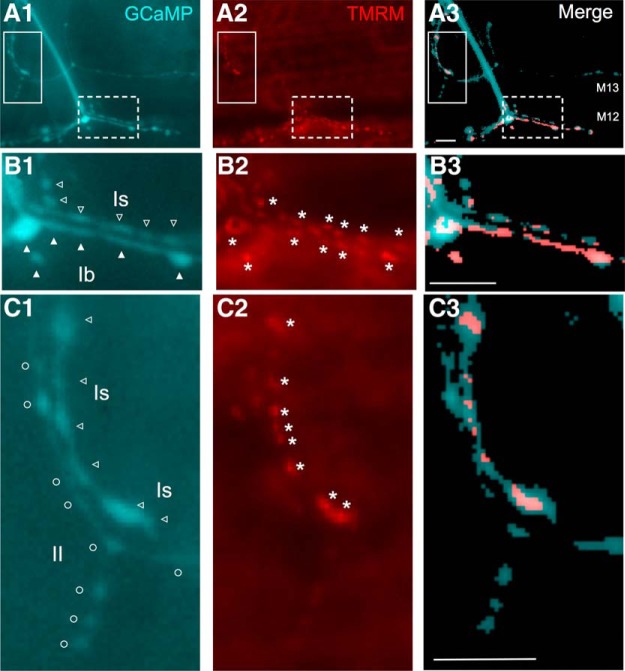
Figure 15.
Differential mitochondrial density in type Ib, Is, and II synapses. Columns 1 and 2 are epifluorescent NMJ images obtained with GCaMP1 baseline fluorescence (cyan) and TMRM mitochondrial staining (red), respectively. Column 3 is the merge of columns 1 and 2. The images of the cyan and red channels were separately thresholded before merging to reveal the bouton contour (cyan) and the most strongly stained spots (red). Content in non-bouton, non-axon area was erased in column 3 for clearer demonstration of overlapping. Row A is representative images of a muscle 12 (bottom, M12 in A3) and 13 (top, M13) NMJs from a WT larva (+/Y; c164-GCaMP1.3). The border between M12 and M13 is faintly visible in A2. Rows B, C are enlarged views of the broken and continuous boxed regions in A, respectively. In Column 1, type Ib, Is, and II boutons are designated with filled arrowheads, open arrowheads, and open circles, respectively. In Column 2, asterisks indicate some areas of stronger TMRM mitochondrial staining. Note that the weak mitochondrial staining in type II synapses was well below the intensity level of type Is synapses. Statistics are presented in Results.

